
Revenue is the number most service businesses can quote off the top of their head. Profit is the one that decides whether the year actually worked, and it is usually the one nobody can find.
The Sales Report closes that gap. It pulls from the jobs and invoices you already have and puts what you sold, what you collected and what you kept in one place, for any date range you choose. You can see which services pay best, which customers and team members bring in the most, and which marketing sources turn into paid work, then hand your bookkeeper clean numbers in one download.
Here is how to run it.
Where to find it
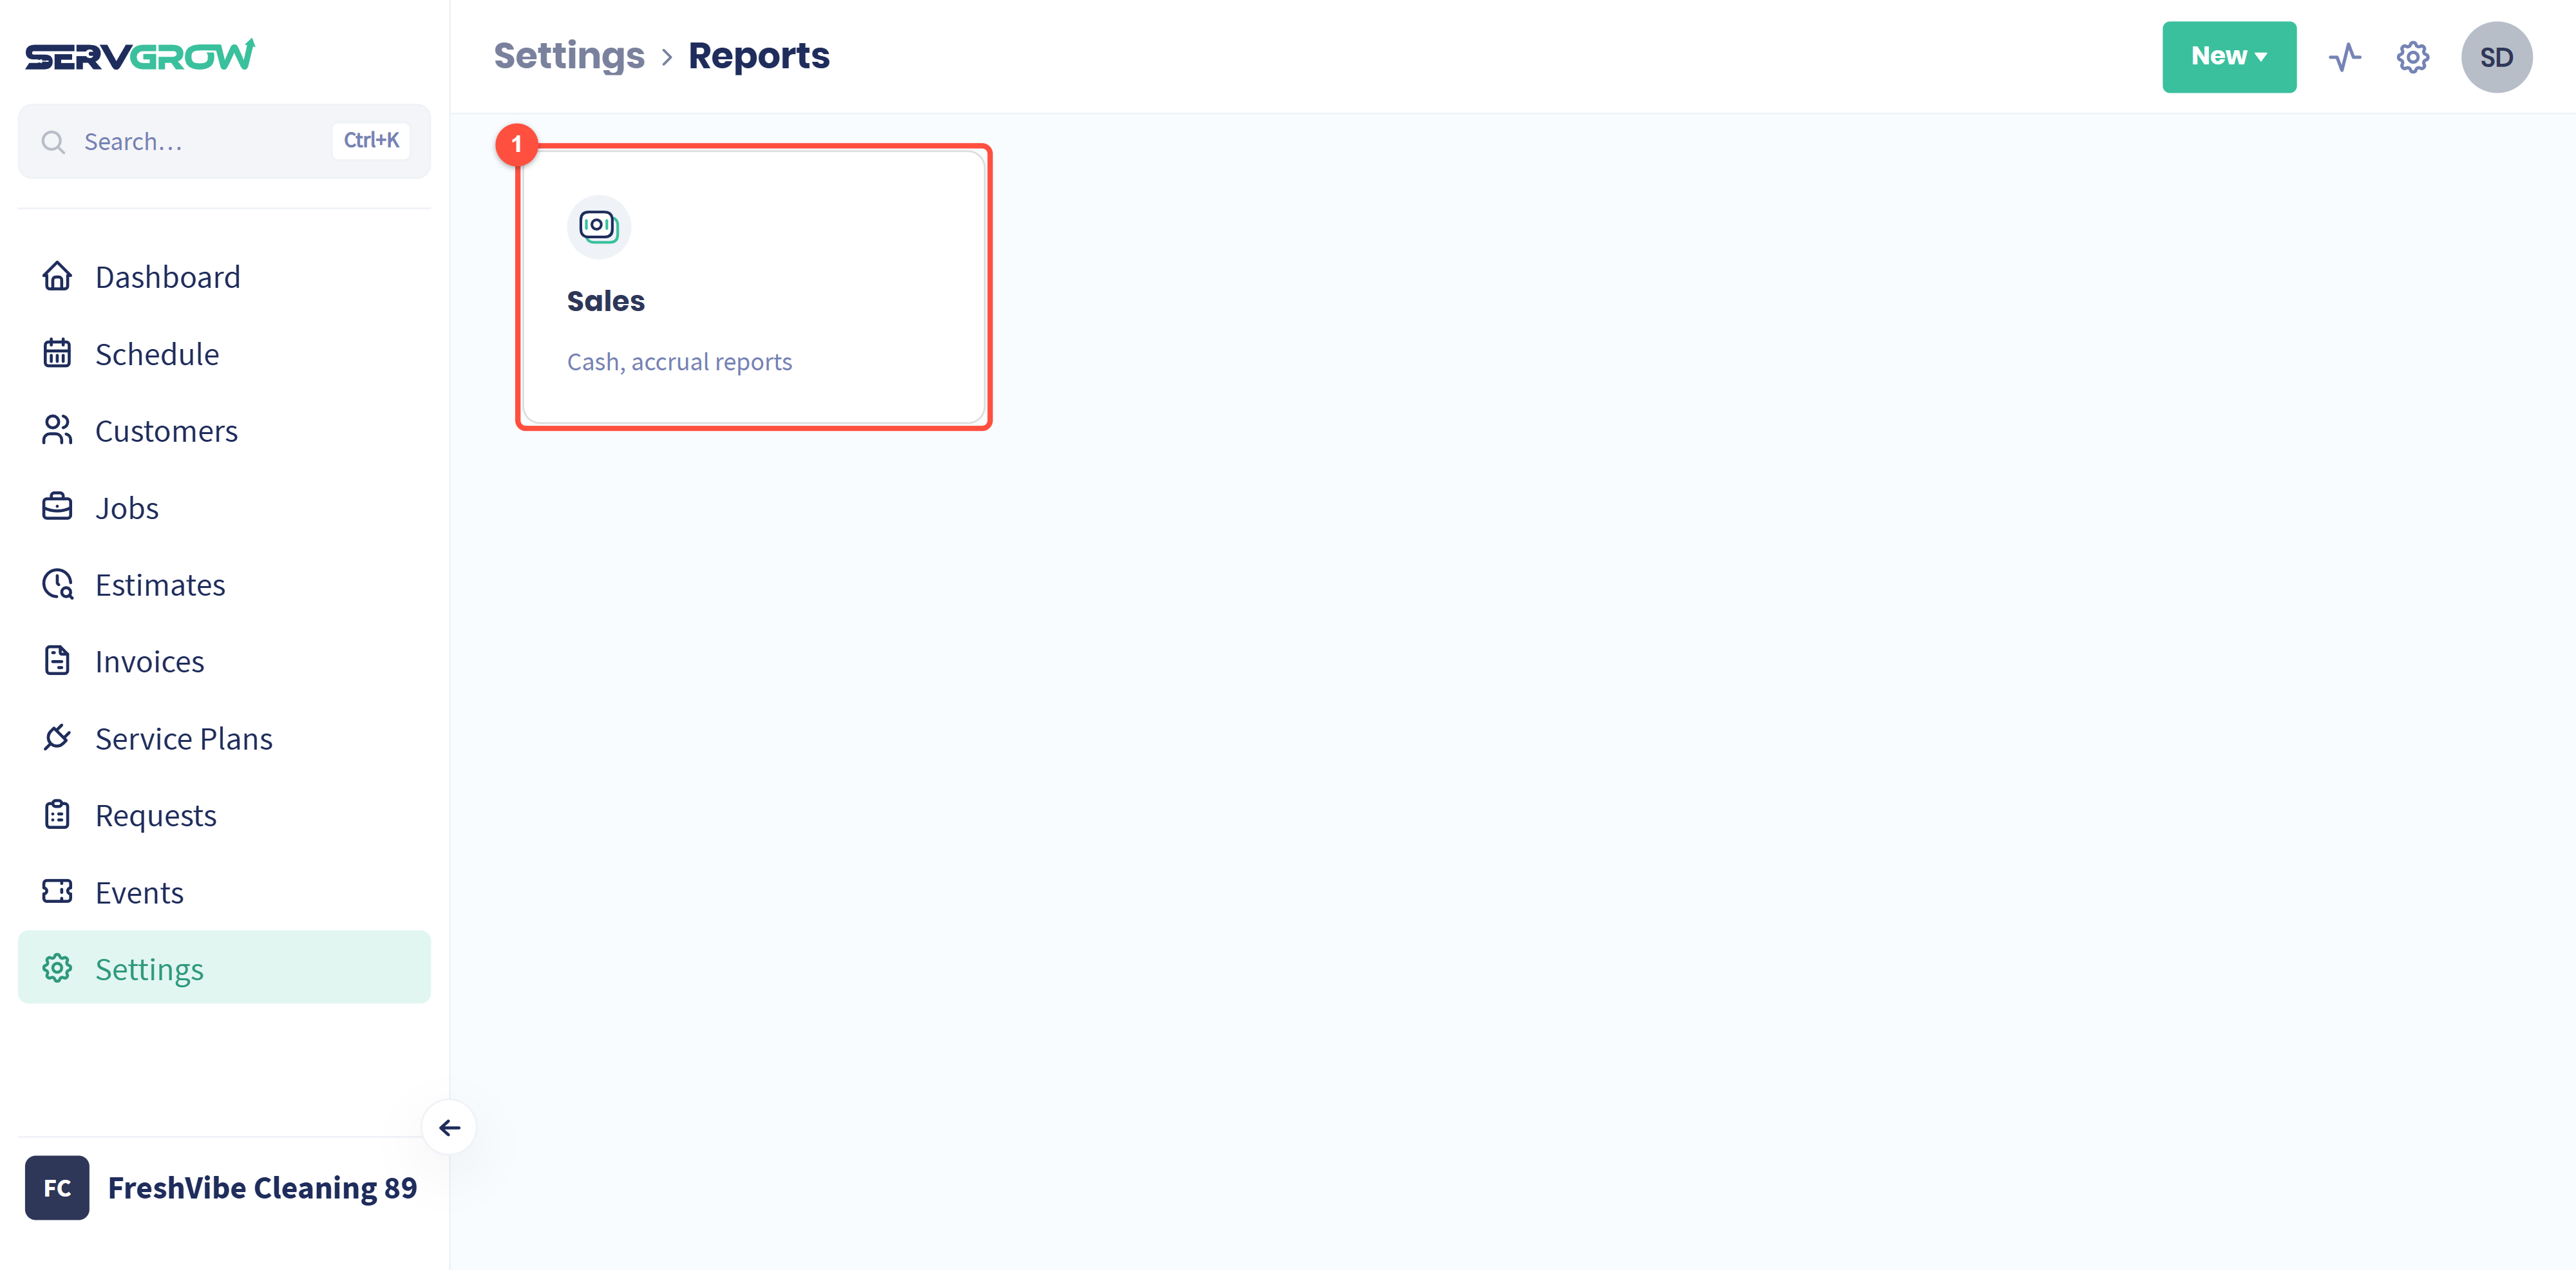
Go to Settings, scroll down to Finances, click Reports, then click Sales.
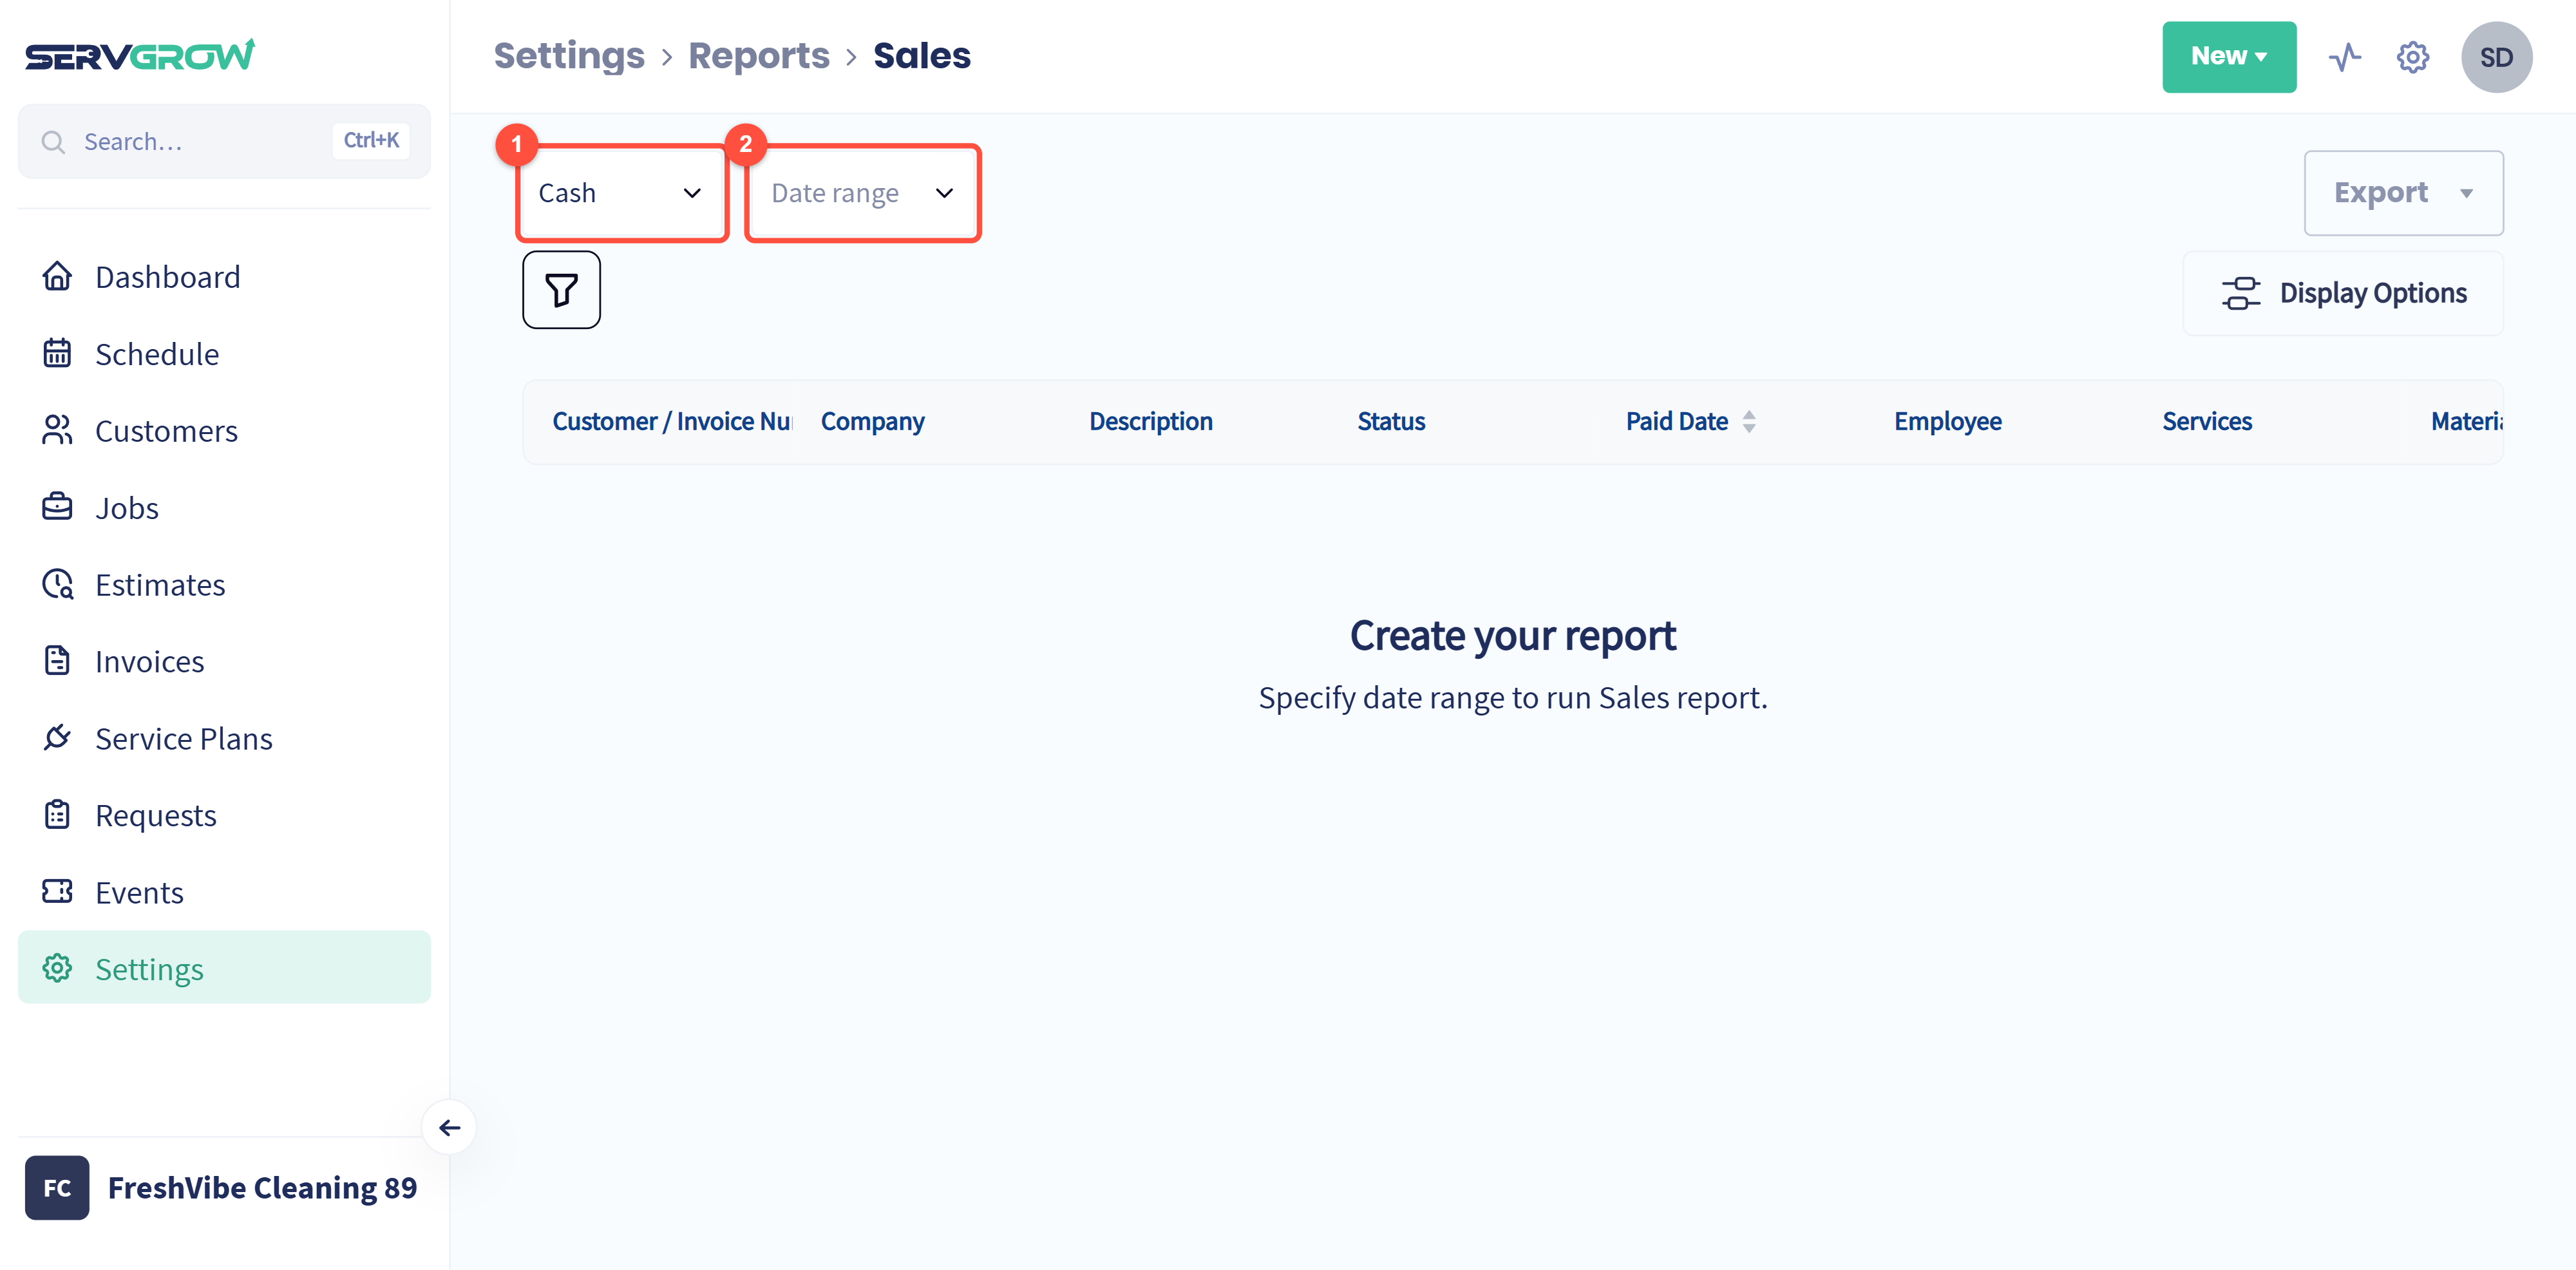
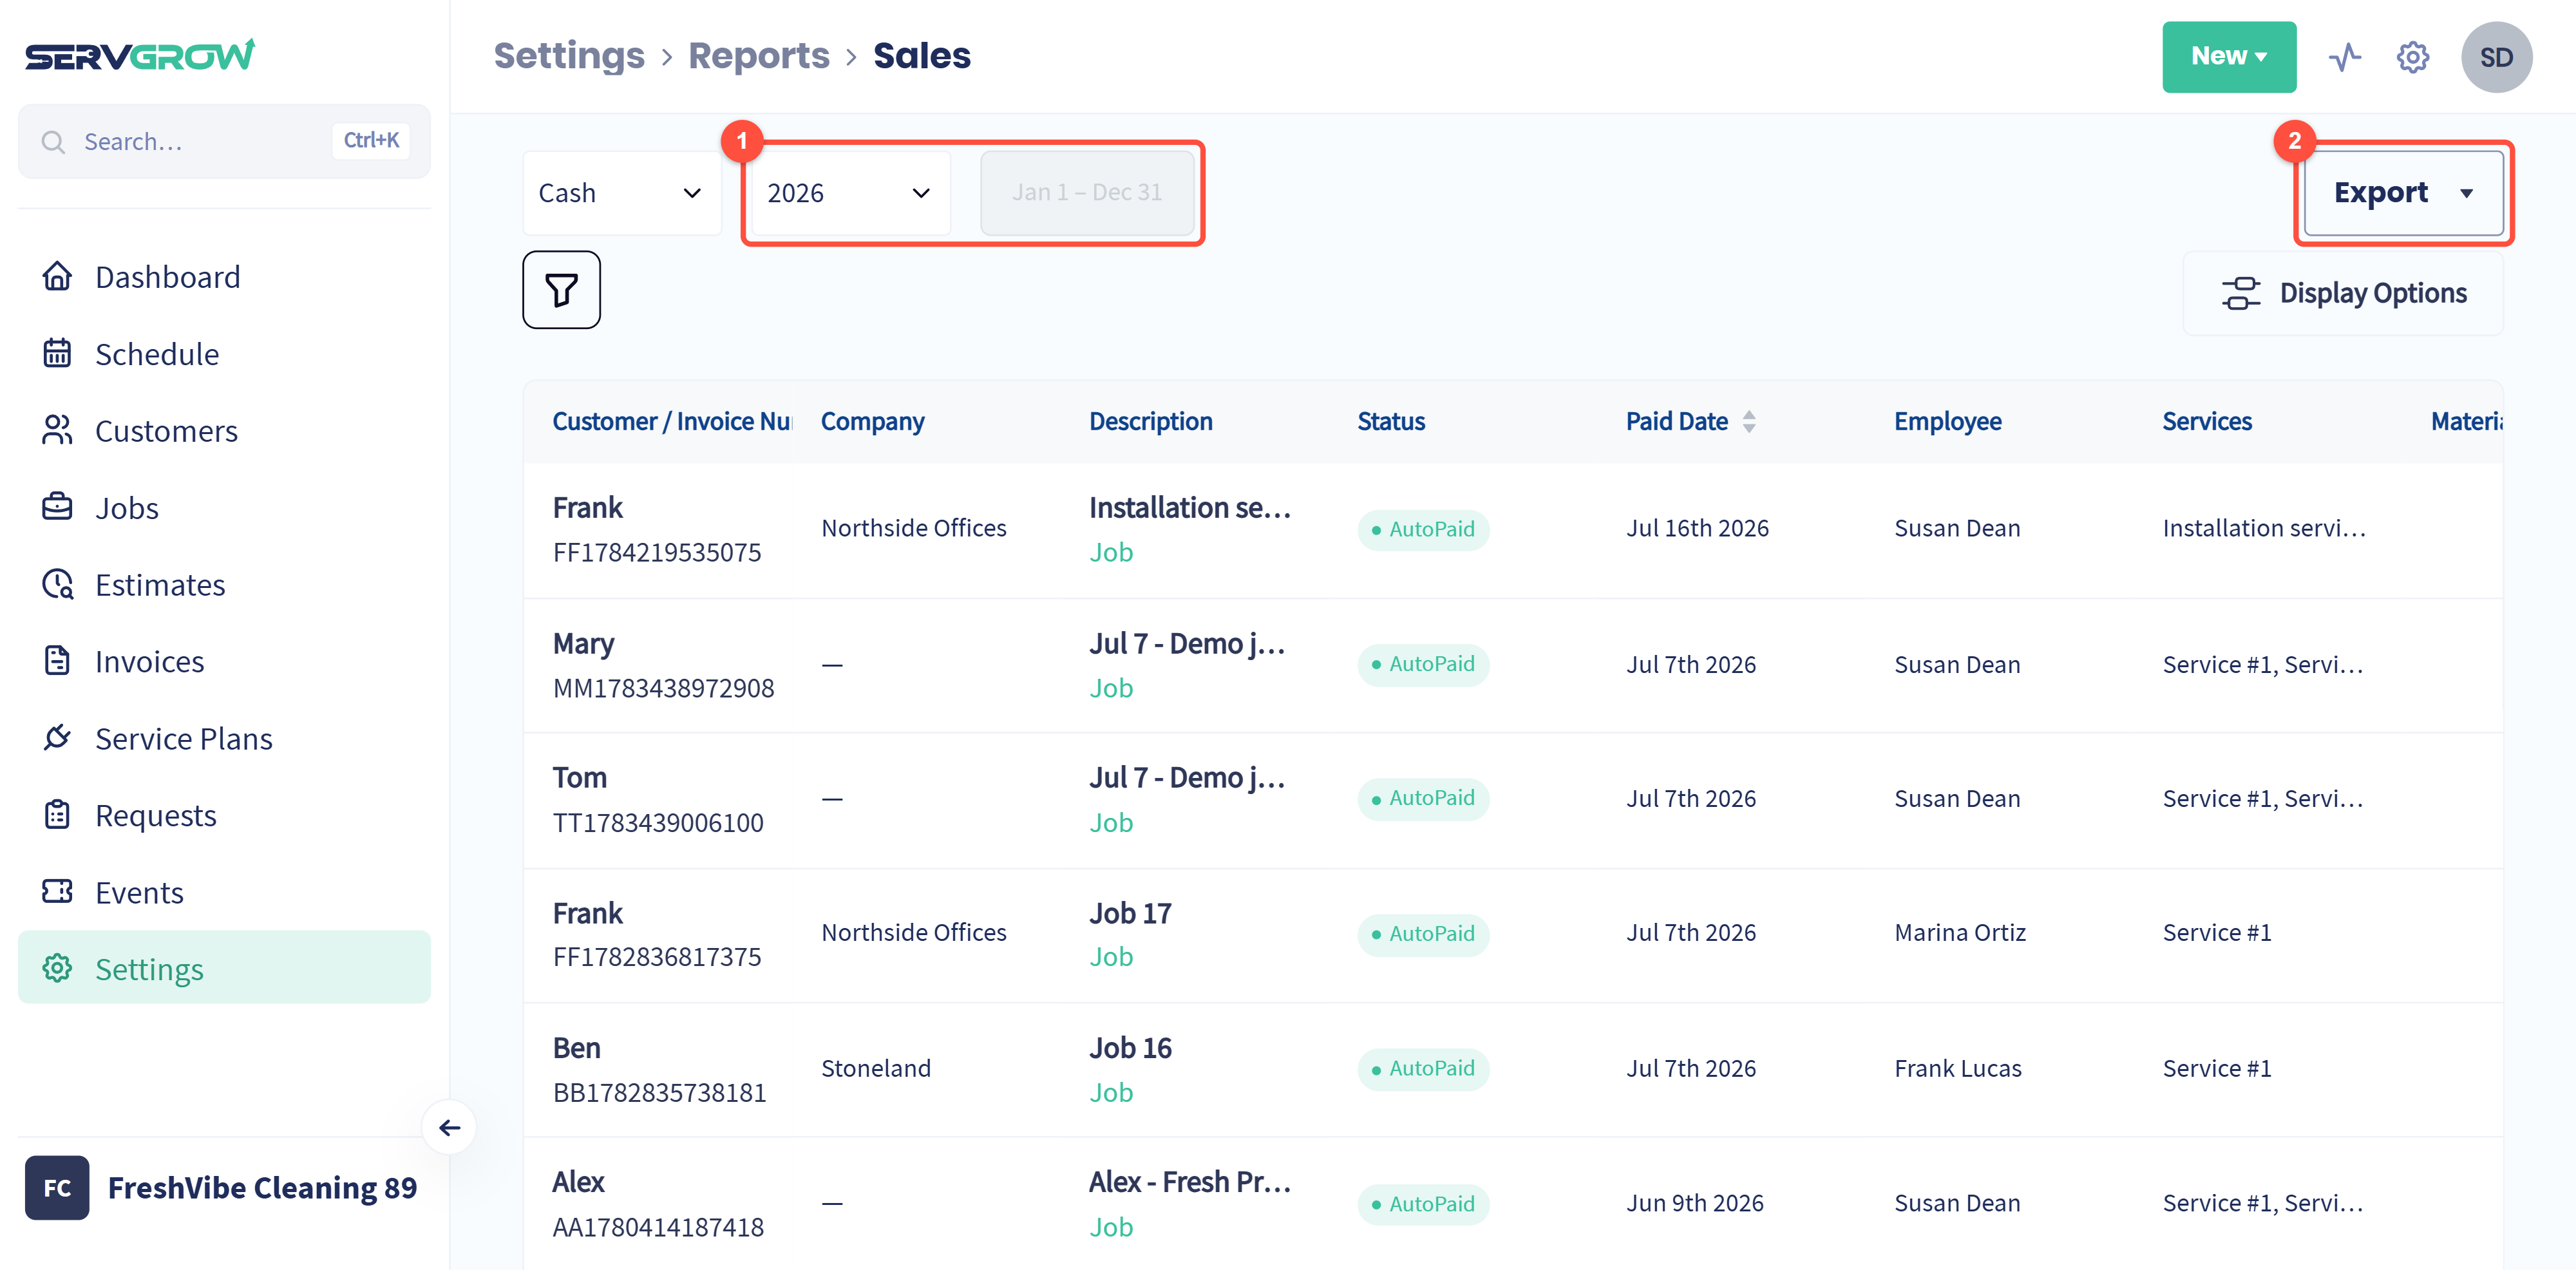
The report opens empty until you choose two things at the top: the accounting basis and a date range.
Part 1: Choose cash or accrual
The first dropdown switches the accounting basis.
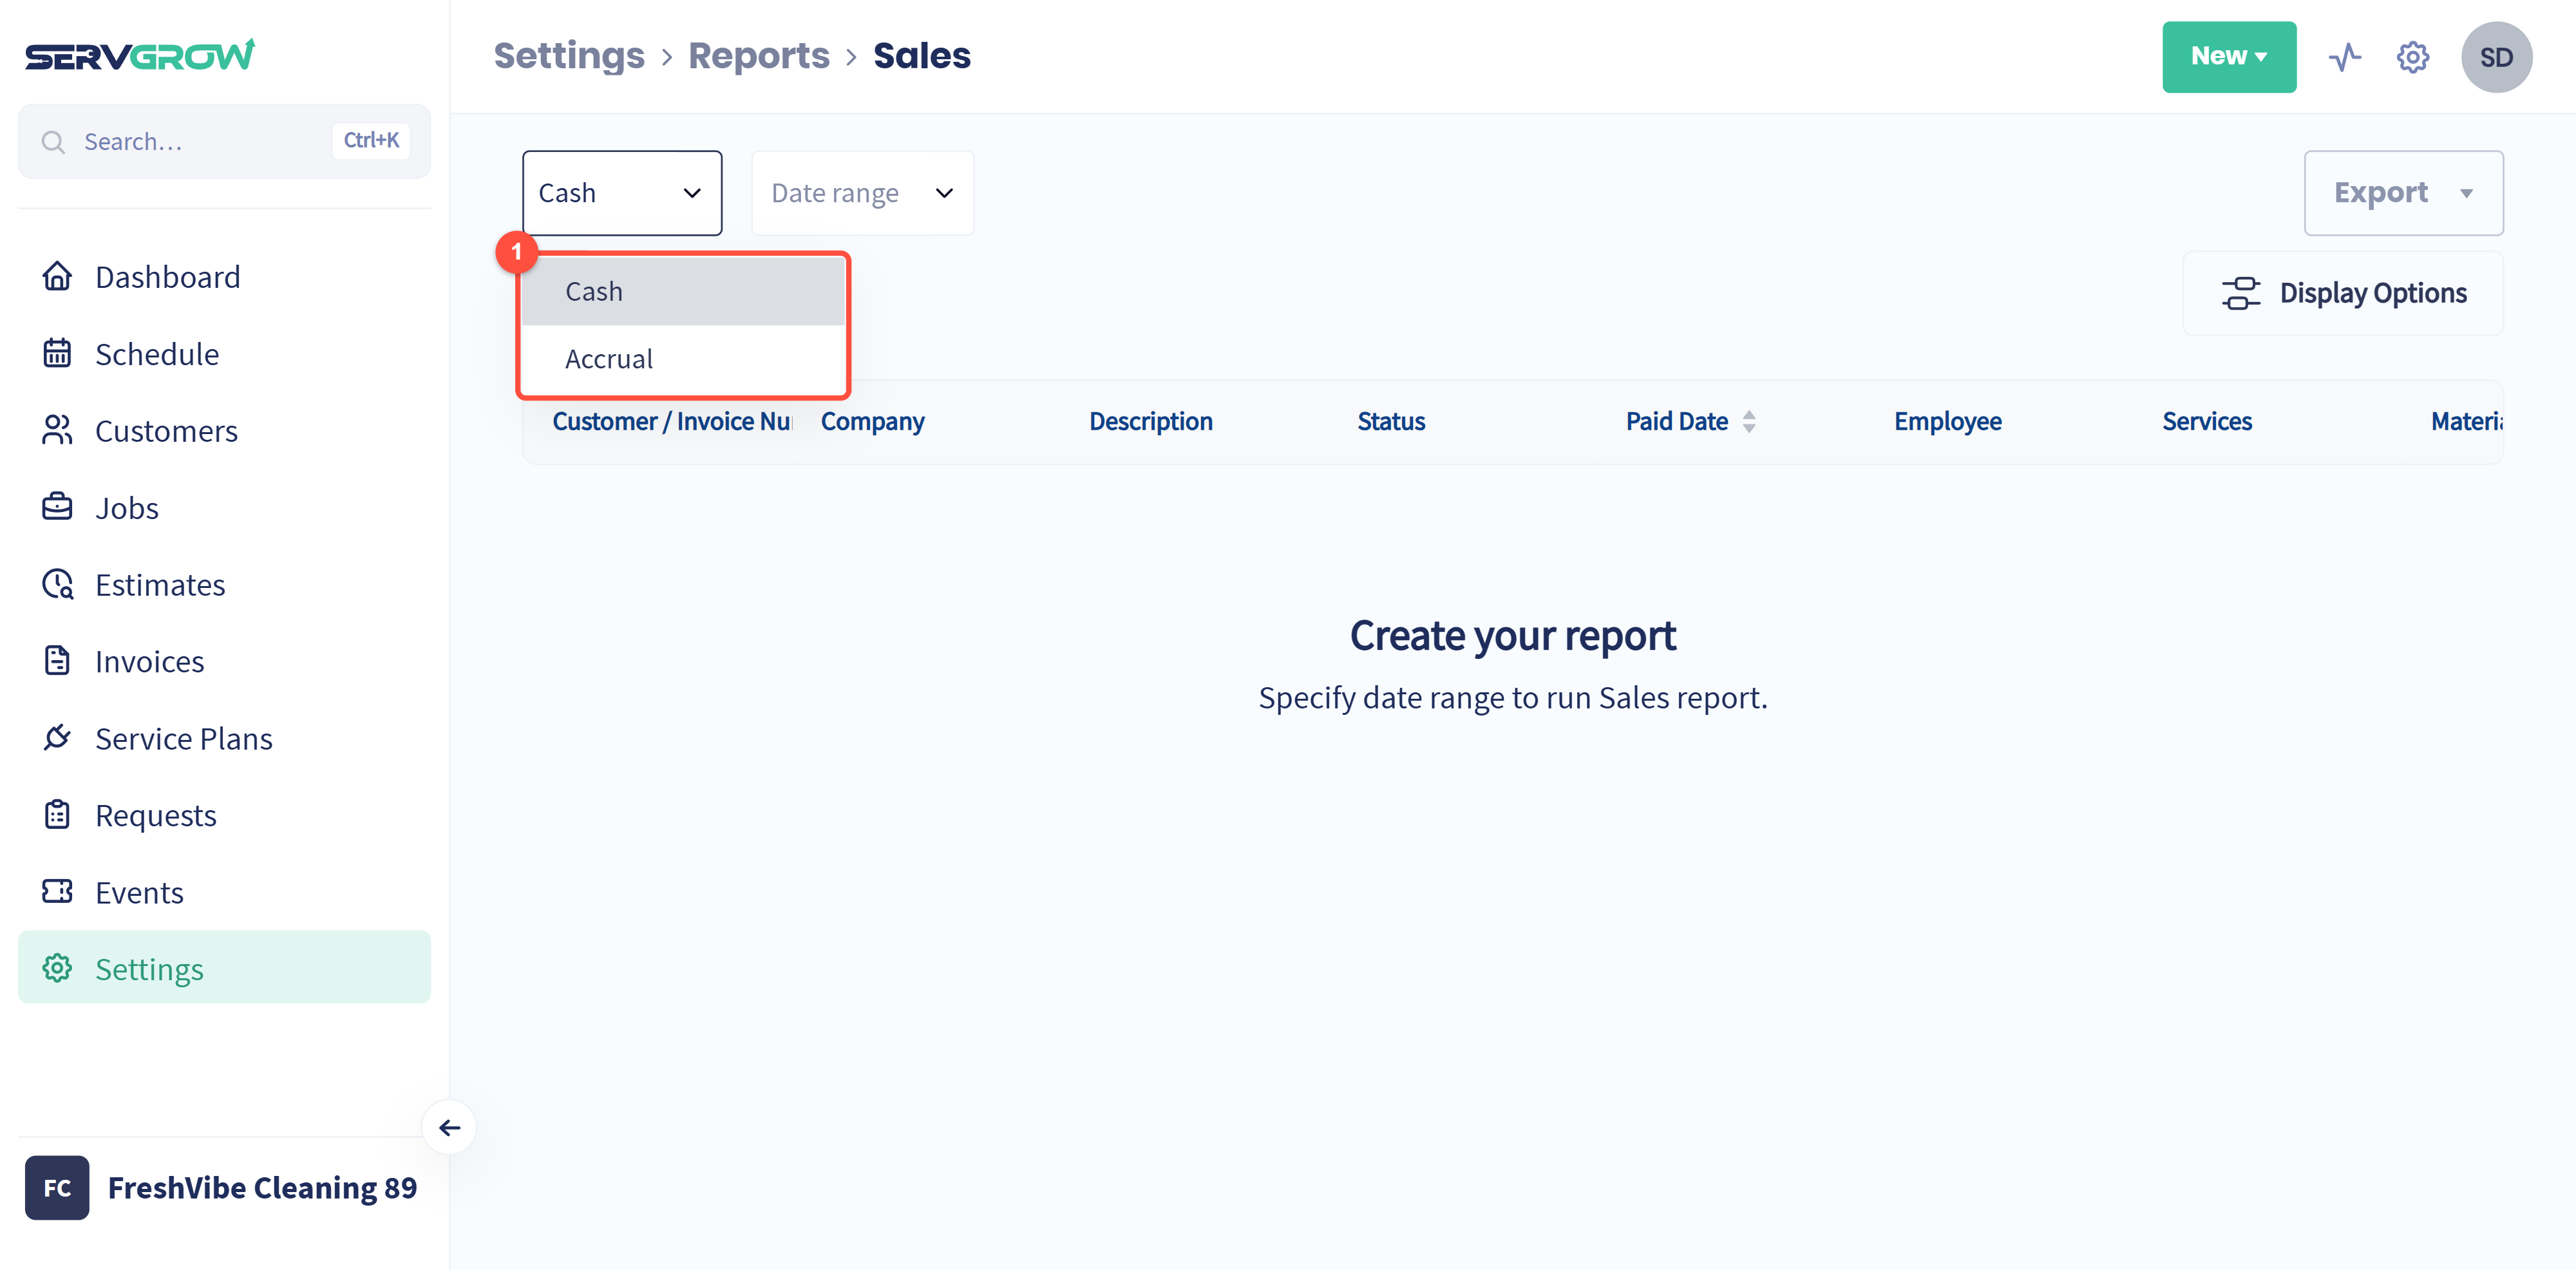
Cash counts money when it actually arrives. A job invoiced in March and paid in April shows up in April. This is how most small service businesses think about their year.
Accrual counts money when the work is done. That same job shows up in March, whether or not the customer has paid yet. It is the truer picture of how much work you sold in a period.
If the two versions of the same period disagree, the gap is money you have earned but not collected yet.
Part 2: Set the date range
Open Date range and pick Current month, a full year, or Custom date range to set your own start and end dates.
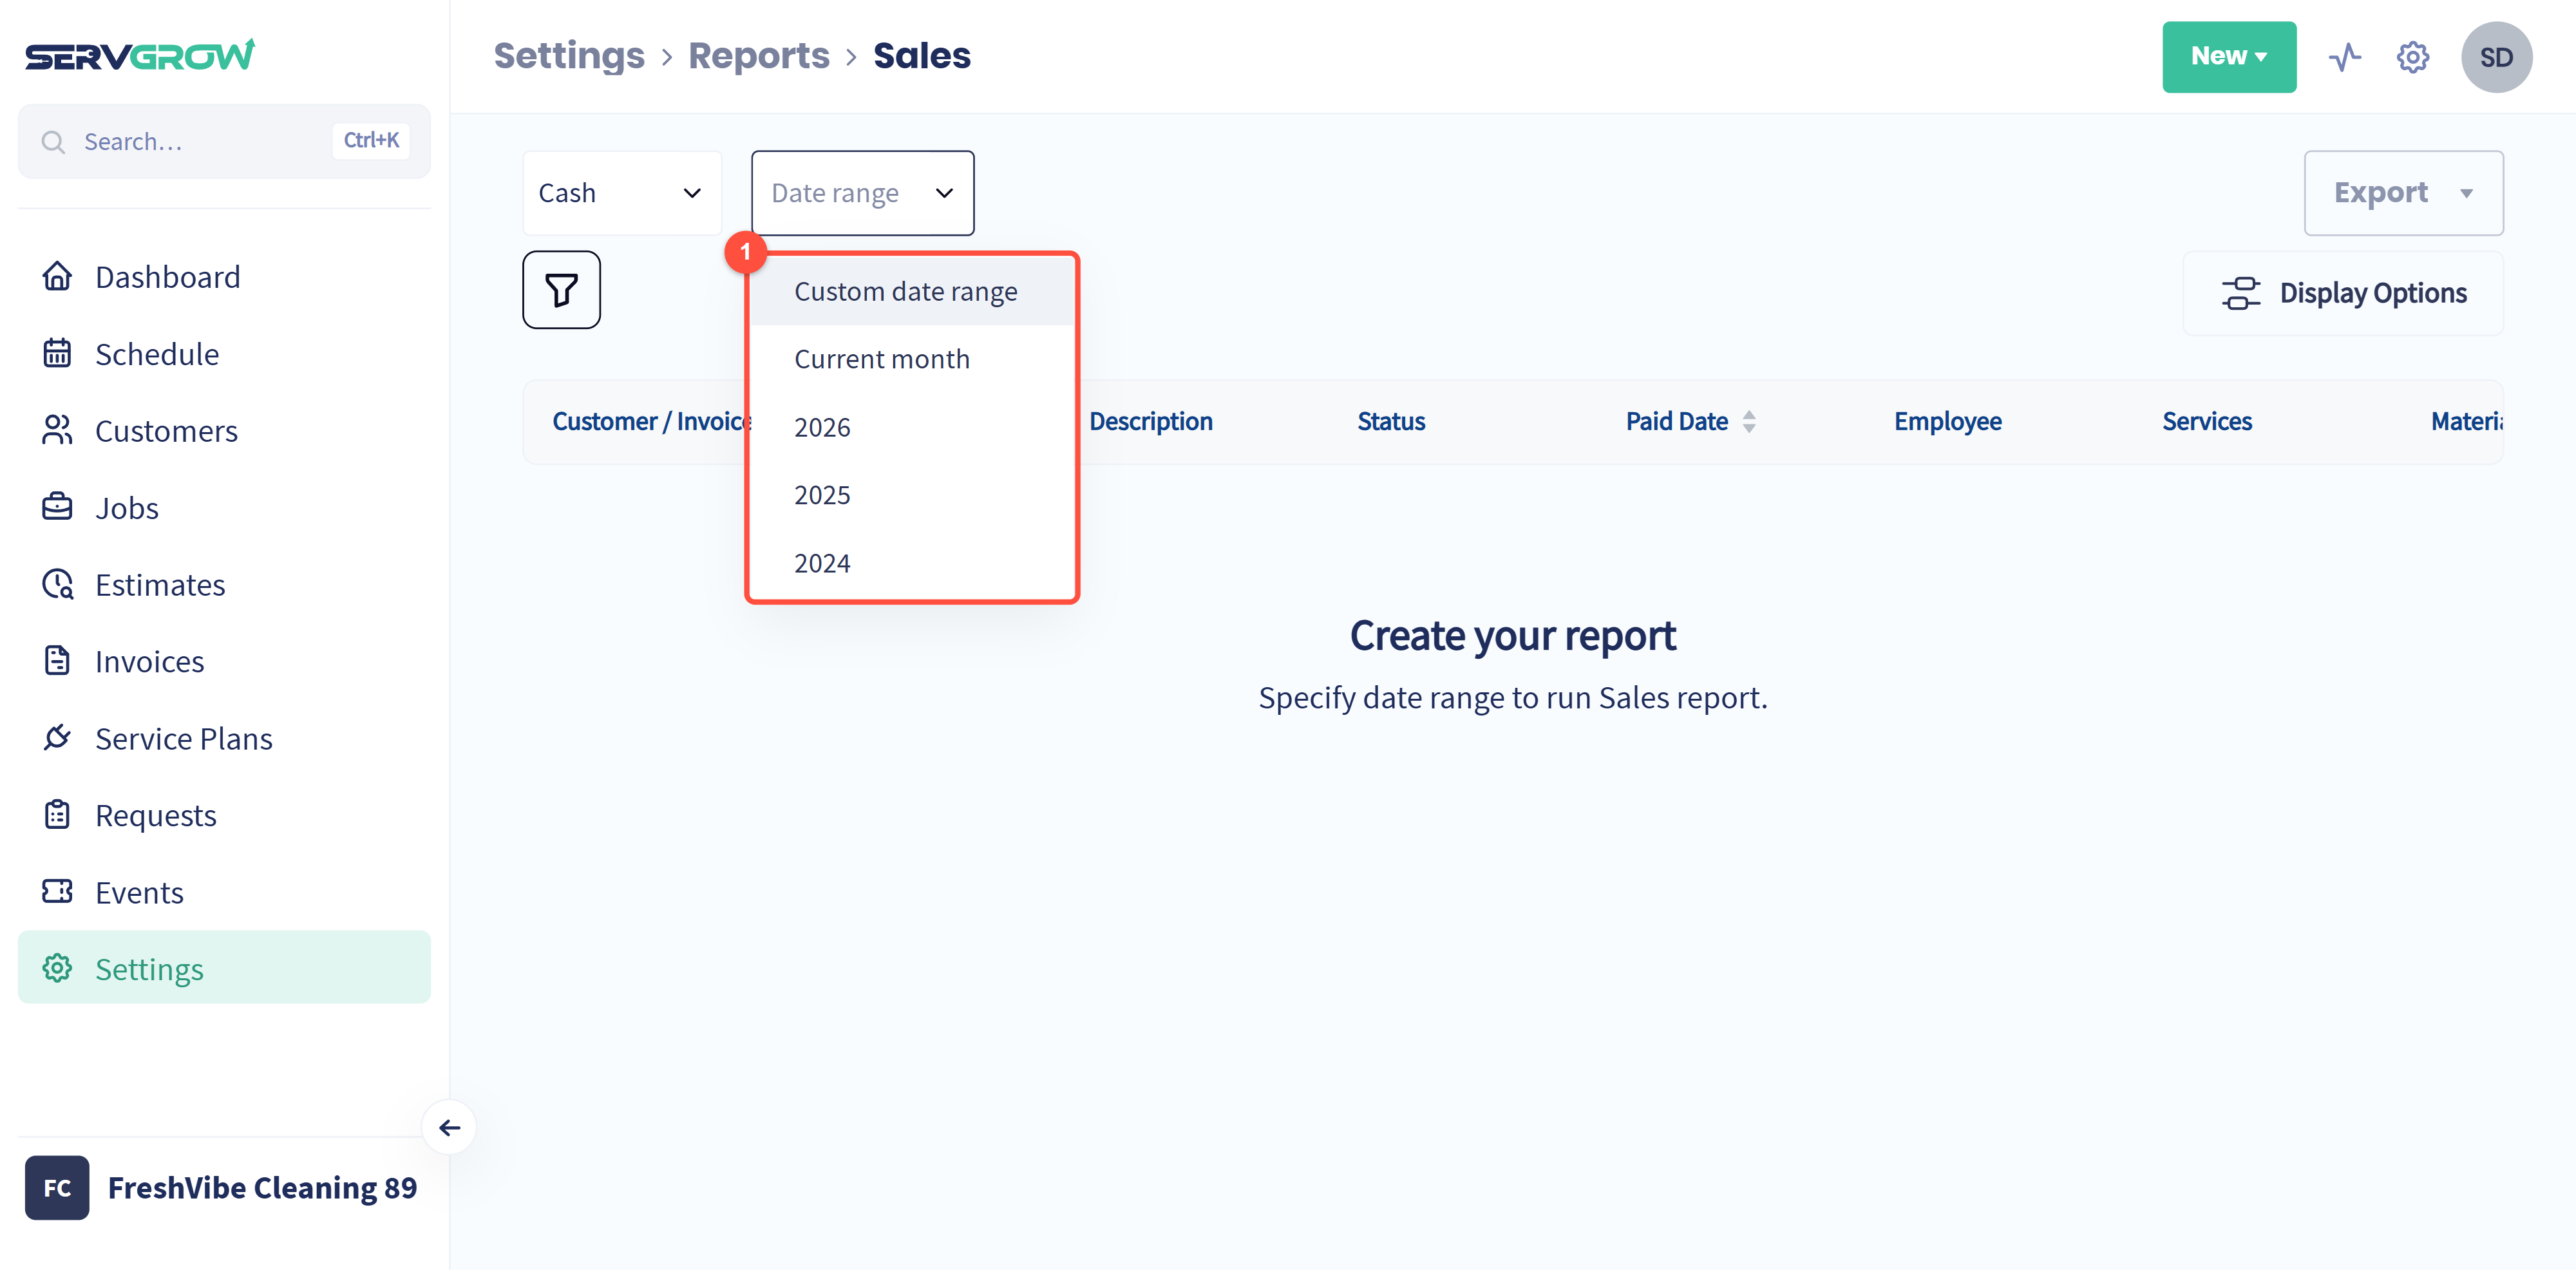
The report runs as soon as you choose, and the dates it covers show next to the dropdown.
Part 3: Narrow it down with filters
Click the funnel icon under the dropdowns to focus the report on exactly what you want to know. You can filter by Employee, Customer Tag, Job Tag, Service, Material, Payment Method, Customer, Company, Source, Status or Tips.

Part 4: Choose your columns
This is where the report earns its keep. Click Display Options and tick only the columns you care about.
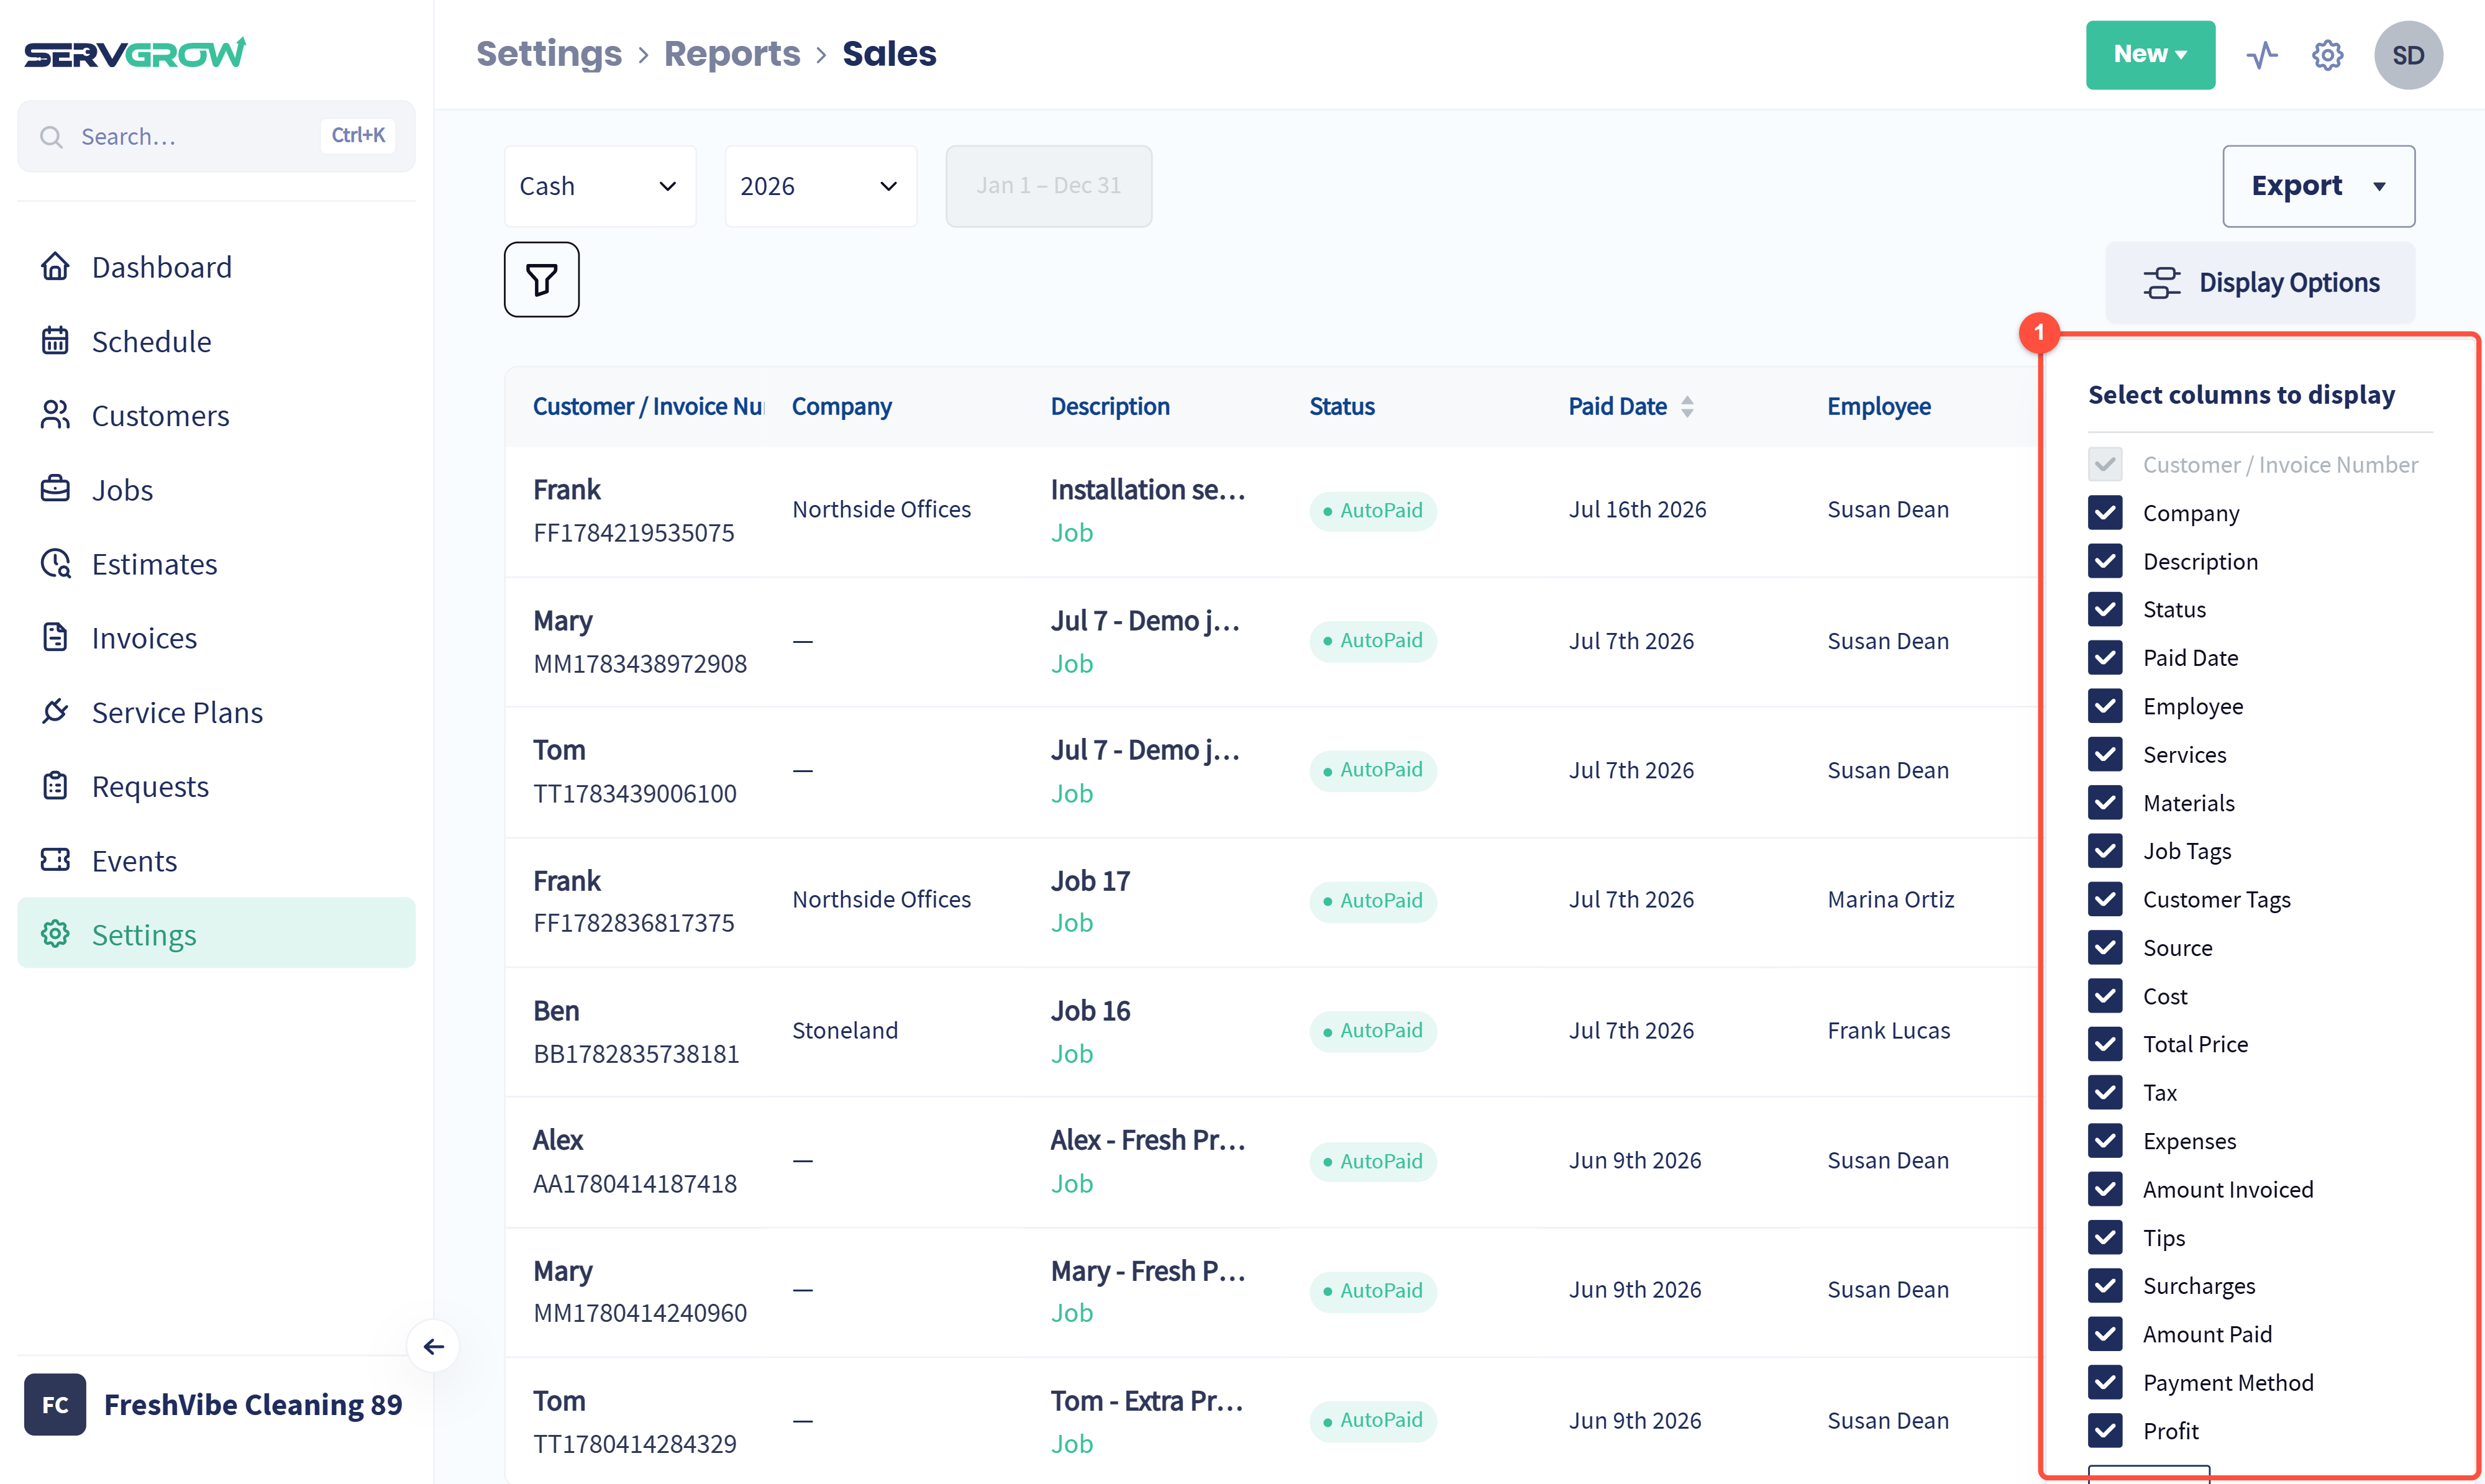
The job: Company, Description, Status, Paid Date, Employee, Services, Materials, Source
The tags: Job Tags, Customer Tags
The money: Cost, Total Price, Tax, Expenses, Amount Invoiced, Tips, Surcharges, Amount Paid, Payment Method, Profit
Customer / Invoice Number is always shown, since it identifies each row.
A report with twenty columns is a spreadsheet nobody reads. Turn off what you are not asking about and the answer gets easier to see.
The two columns most people miss
Profit is the whole point, and it is only as accurate as the costs behind it. Expenses shows what you spent on each job. If that column is empty, your Profit column is really just revenue with a different label.
If you are not logging expenses yet, start there. See Expense Tracking: Know What Every Job Really Costs.
Part 5: Export it
Click Export and choose CSV to download the report for your bookkeeper or open it in a spreadsheet. Set your date range and filters first, so the file answers the question you are asking.
Three questions worth answering every month
Which services actually make money? Filter by Service and show Total Price, Expenses and Profit. The answer is often not the service you do most.
Where is your best work coming from? Filter by Source to see which marketing brings in paying jobs, not just enquiries.
What is still owed? Run the same range on Cash and on Accrual. The difference is money you have earned but not collected.
Related articles