
Most owners run the business from memory: which jobs are coming up, who still hasn't paid, which estimates are waiting on an answer. Something always slips through, and it is usually money.
Your Servgrow Dashboard puts all of it on one screen. It shows what you have billed and collected, what is on the schedule and what that work is worth, who owes you, which estimates need a follow-up and how many new requests came in. A two-minute look each morning tells you where to spend your day. Over time, the same numbers show whether the business is actually growing.
Where to find it
Click Dashboard at the top of the left menu.
Your dashboard at a glance
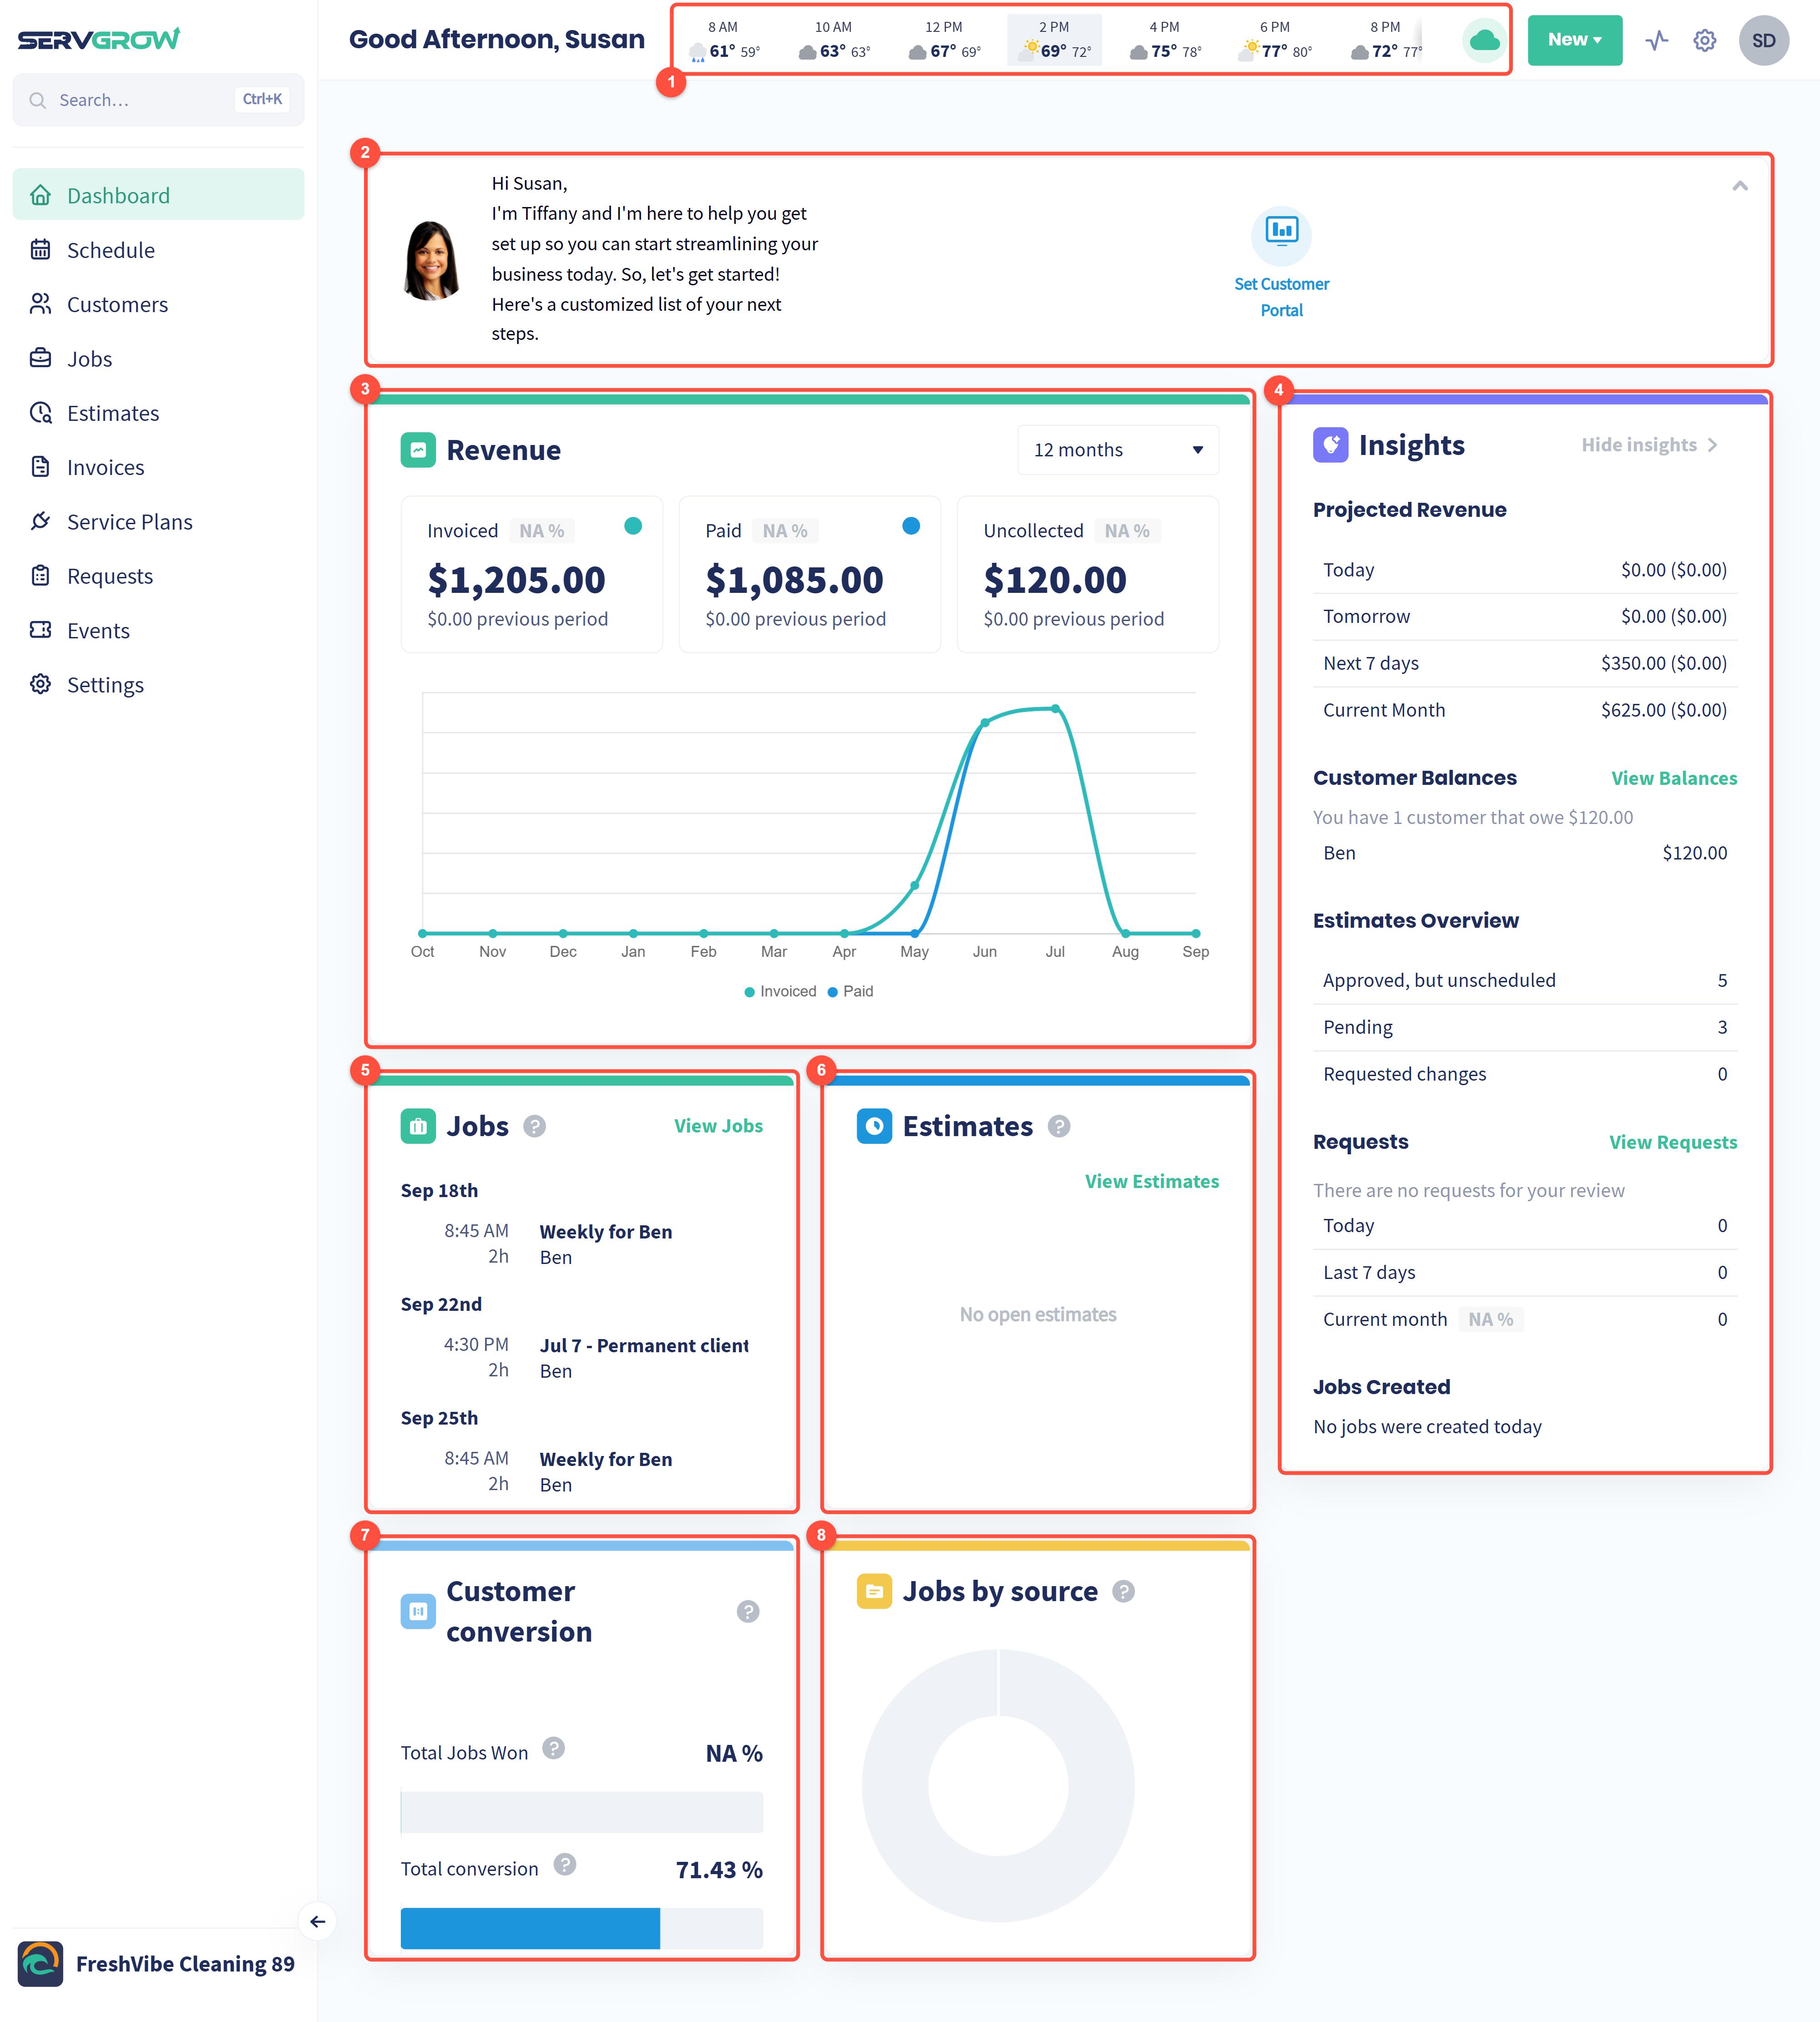
Weather: today's forecast, hour by hour.
Setup steps: what is left to finish setting up your account.
Revenue: what you have invoiced, collected and are still owed.
Insights: projected revenue, customer balances, estimates, requests and jobs created today.
Jobs: the jobs and service plan visits coming up.
Estimates: upcoming estimate appointments.
Customer conversion: how many estimates you win and how many customers pay.
Jobs by source: which lead sources bring you paying customers.
What you see depends on your role. Company Admins see every panel. Office Staff see Jobs, Estimates and Insights, but not Revenue, Customer conversion or Jobs by source. Field Techs do not have a Dashboard.
Today's weather
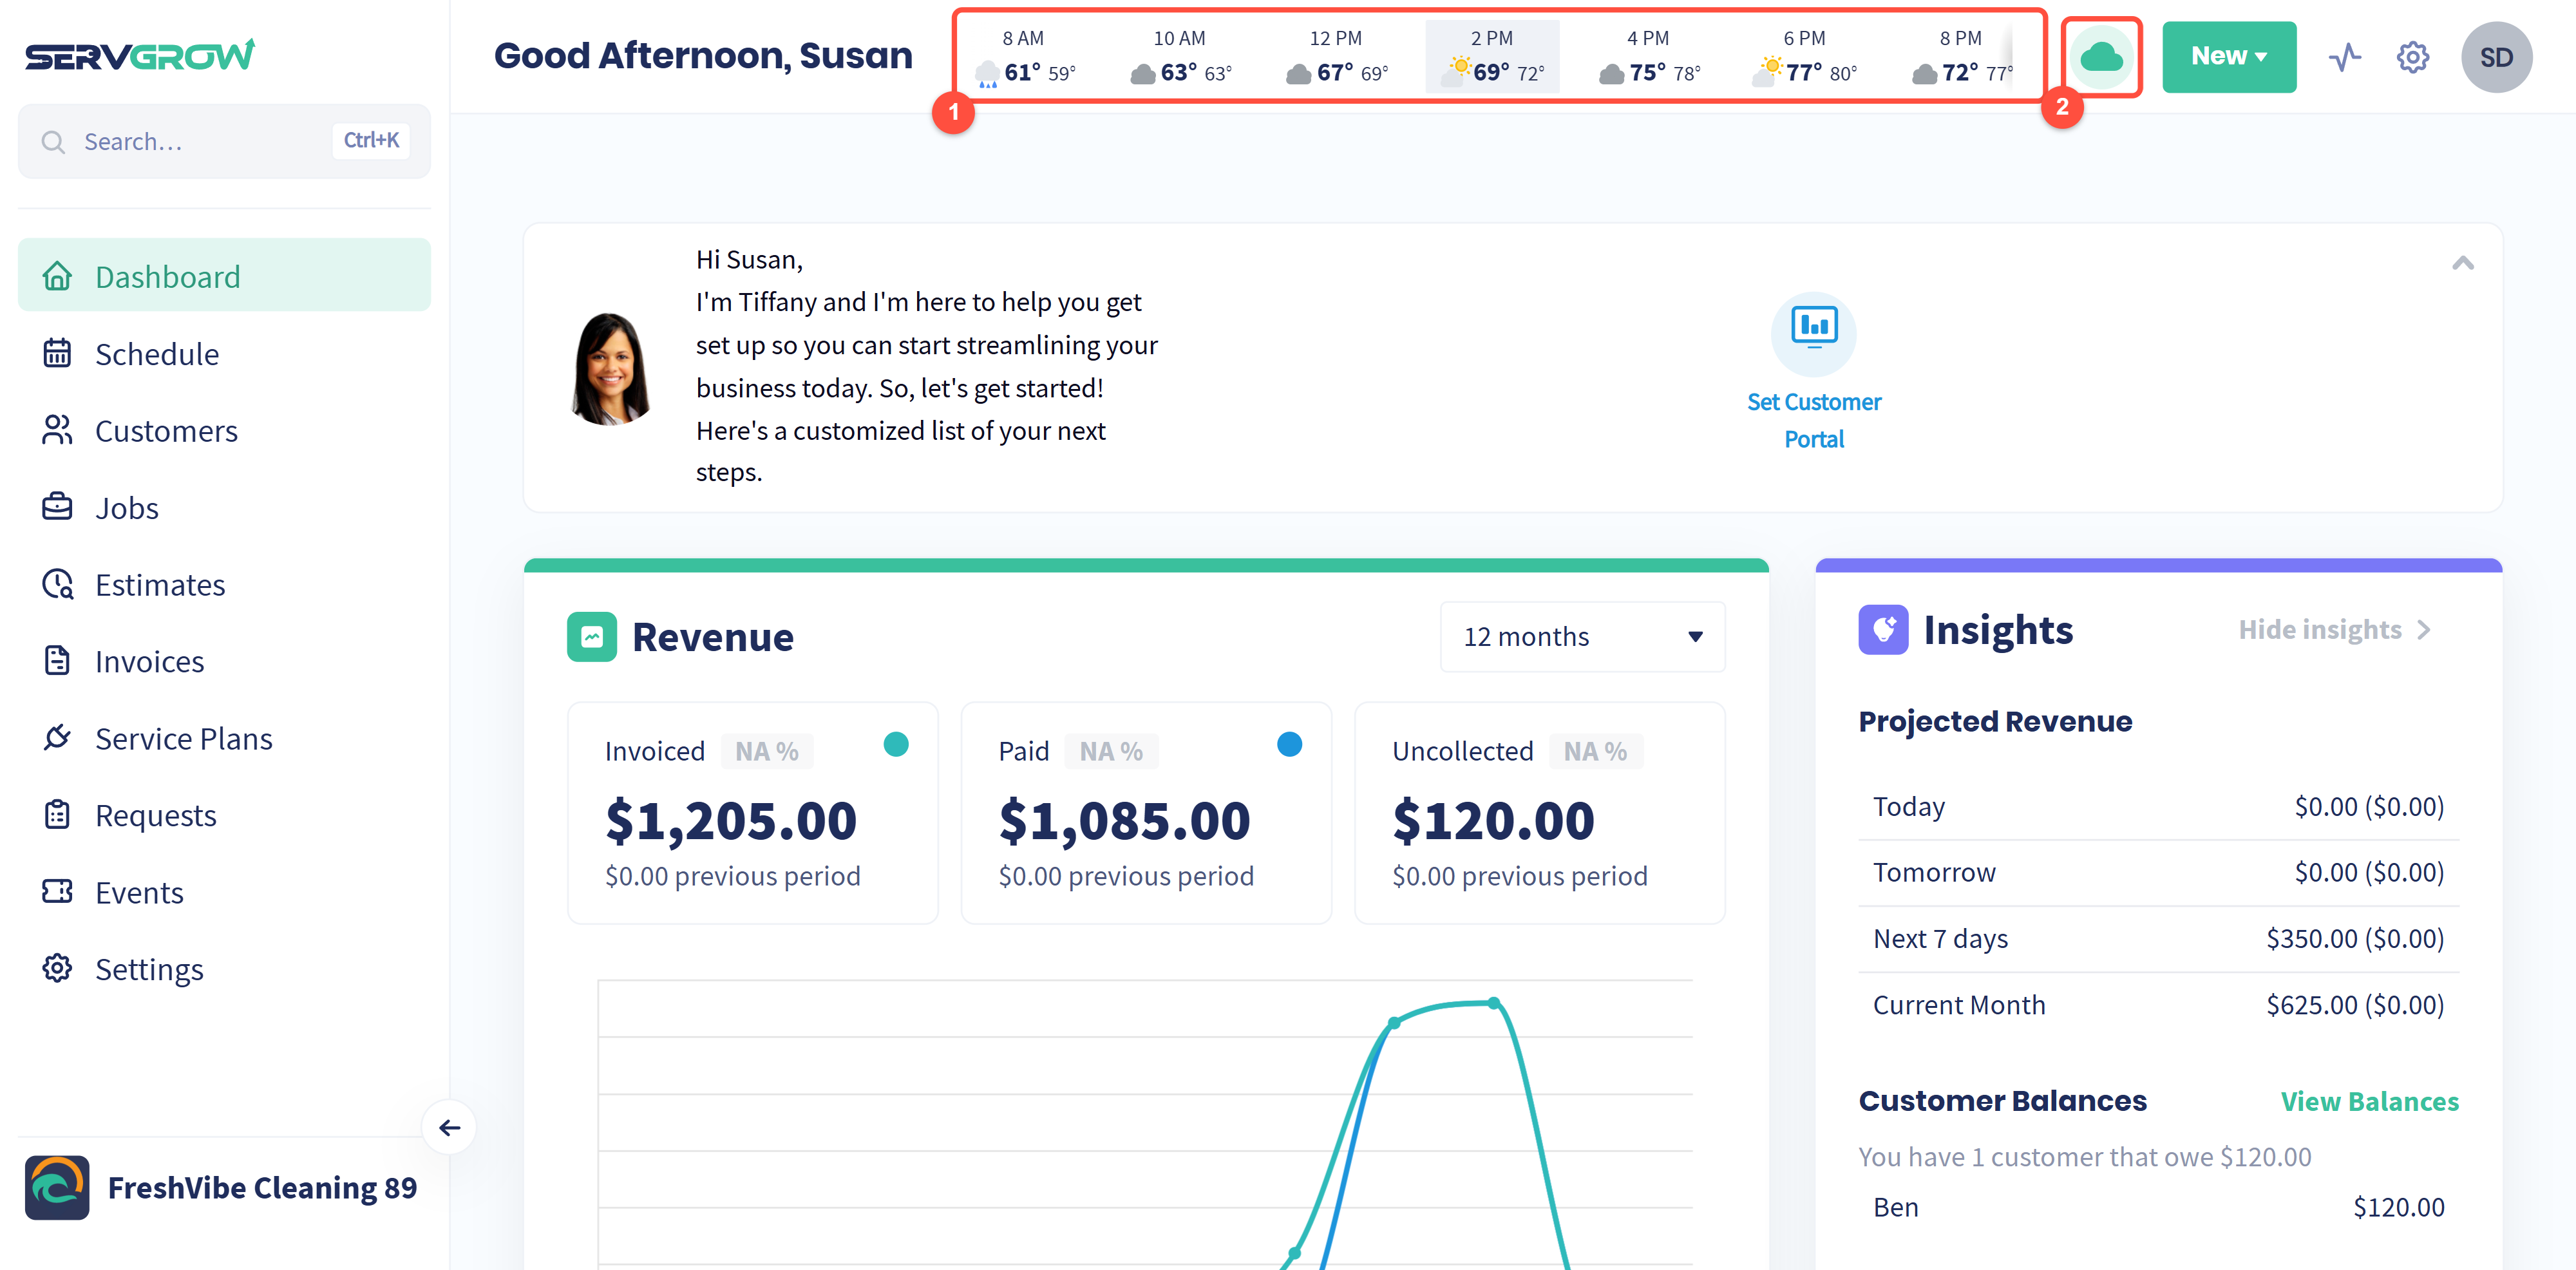
The forecast for today at your business address, hour by hour. Each hour shows the temperature, with what it feels like next to it. Use it to plan outdoor work and to warn customers about weather delays before they happen. It uses the address in your Company Profile.
Click the cloud button to hide the forecast, and click it again to bring it back.
Finish setting up your account
Until your account is fully set up, a card at the top lists the steps you still have left. The full list is Set Company Profile, Accept Online Payments, Add Services And Prices, Add/Import Your Customer List, Set up Your Auto Texts/Emails, Schedule a Job, Set Customer Portal and Set Online Booking.
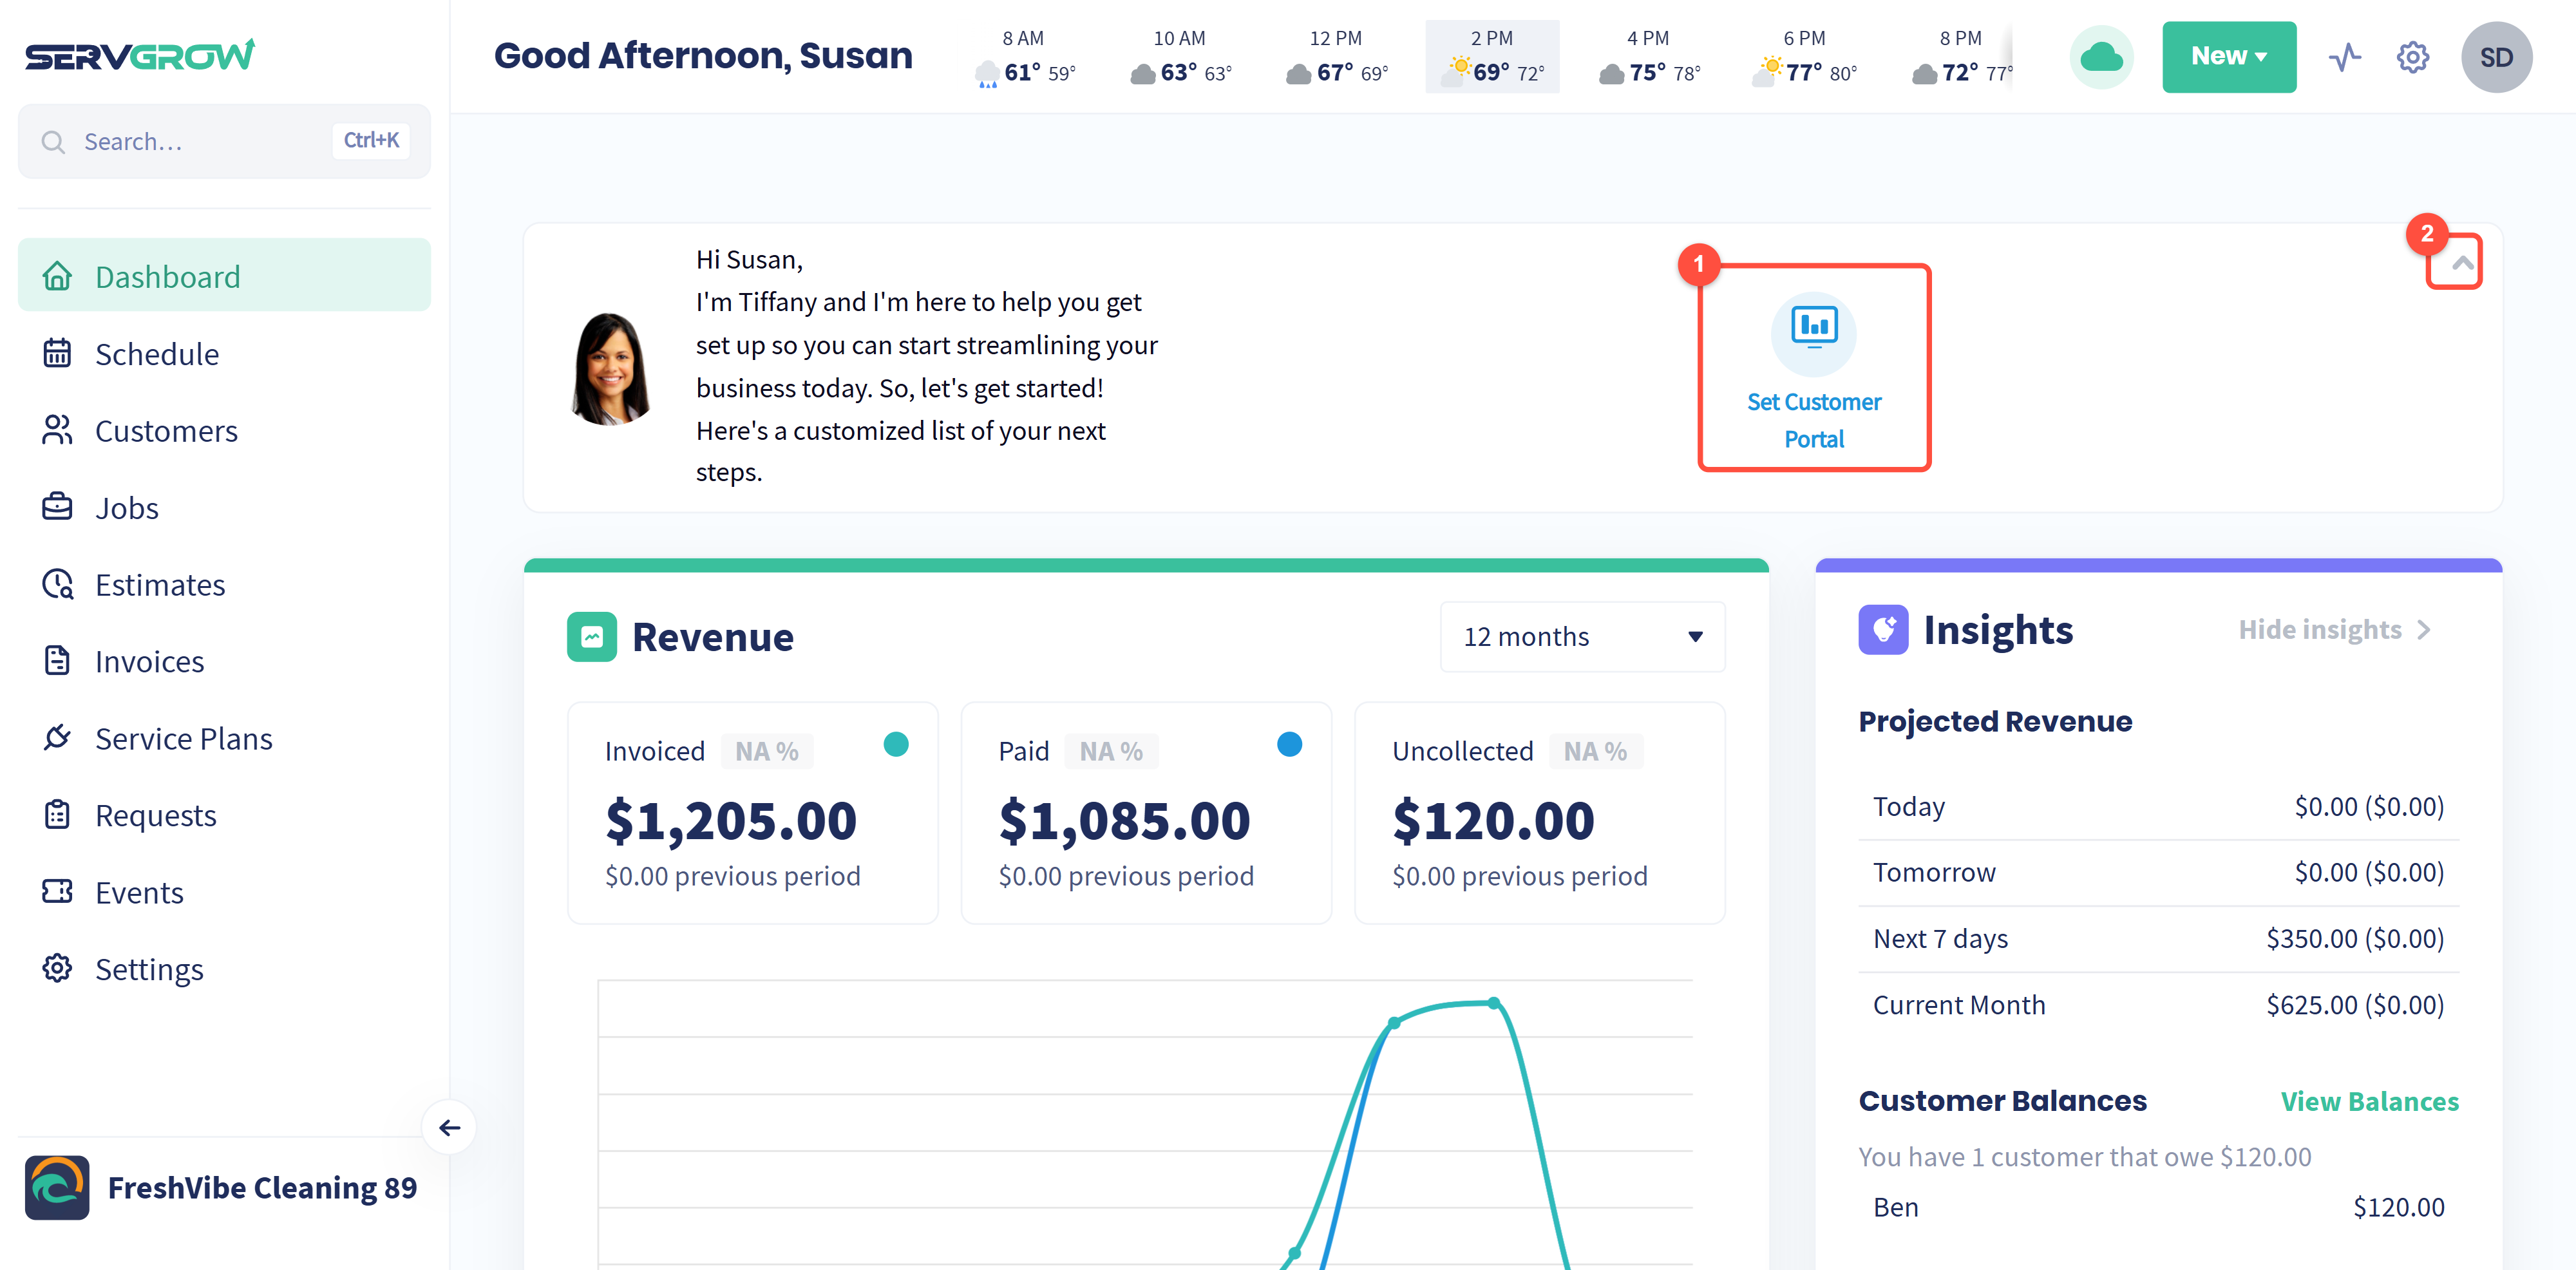
Click a step to go straight to where you set it up. Finished steps drop off the list.
Click the arrow to shrink the card to a single line.
Revenue
Choose the time period in the top right of the Revenue panel: 12 months (this month and the 11 before it), Current year or Last year.
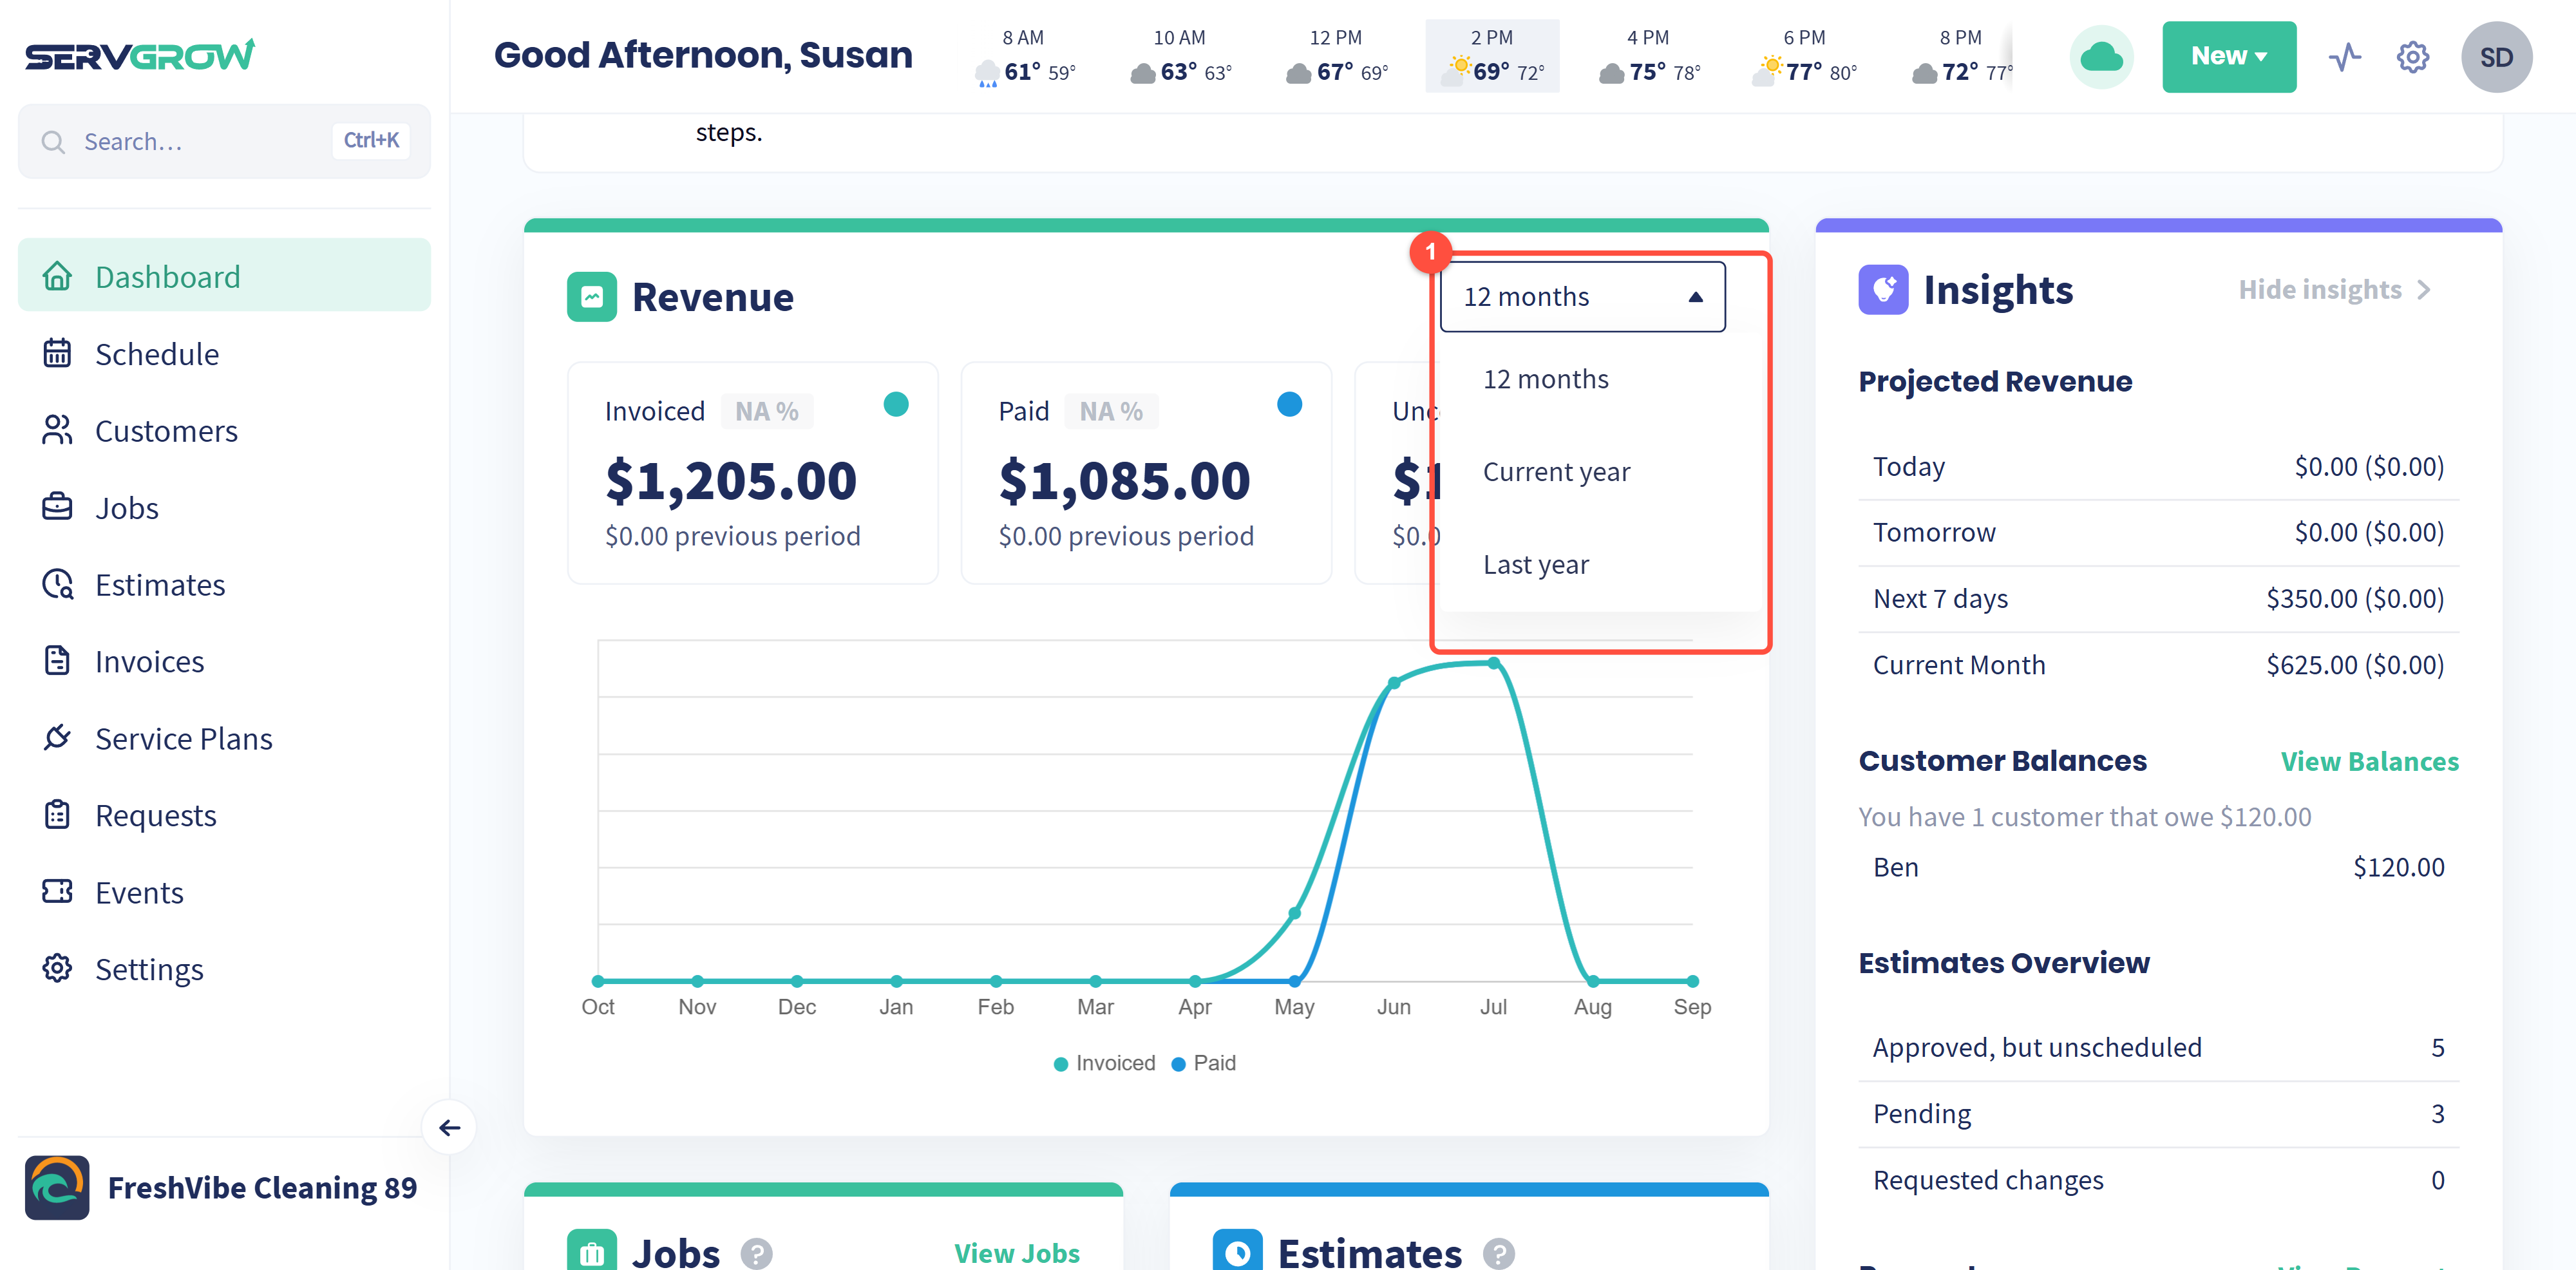
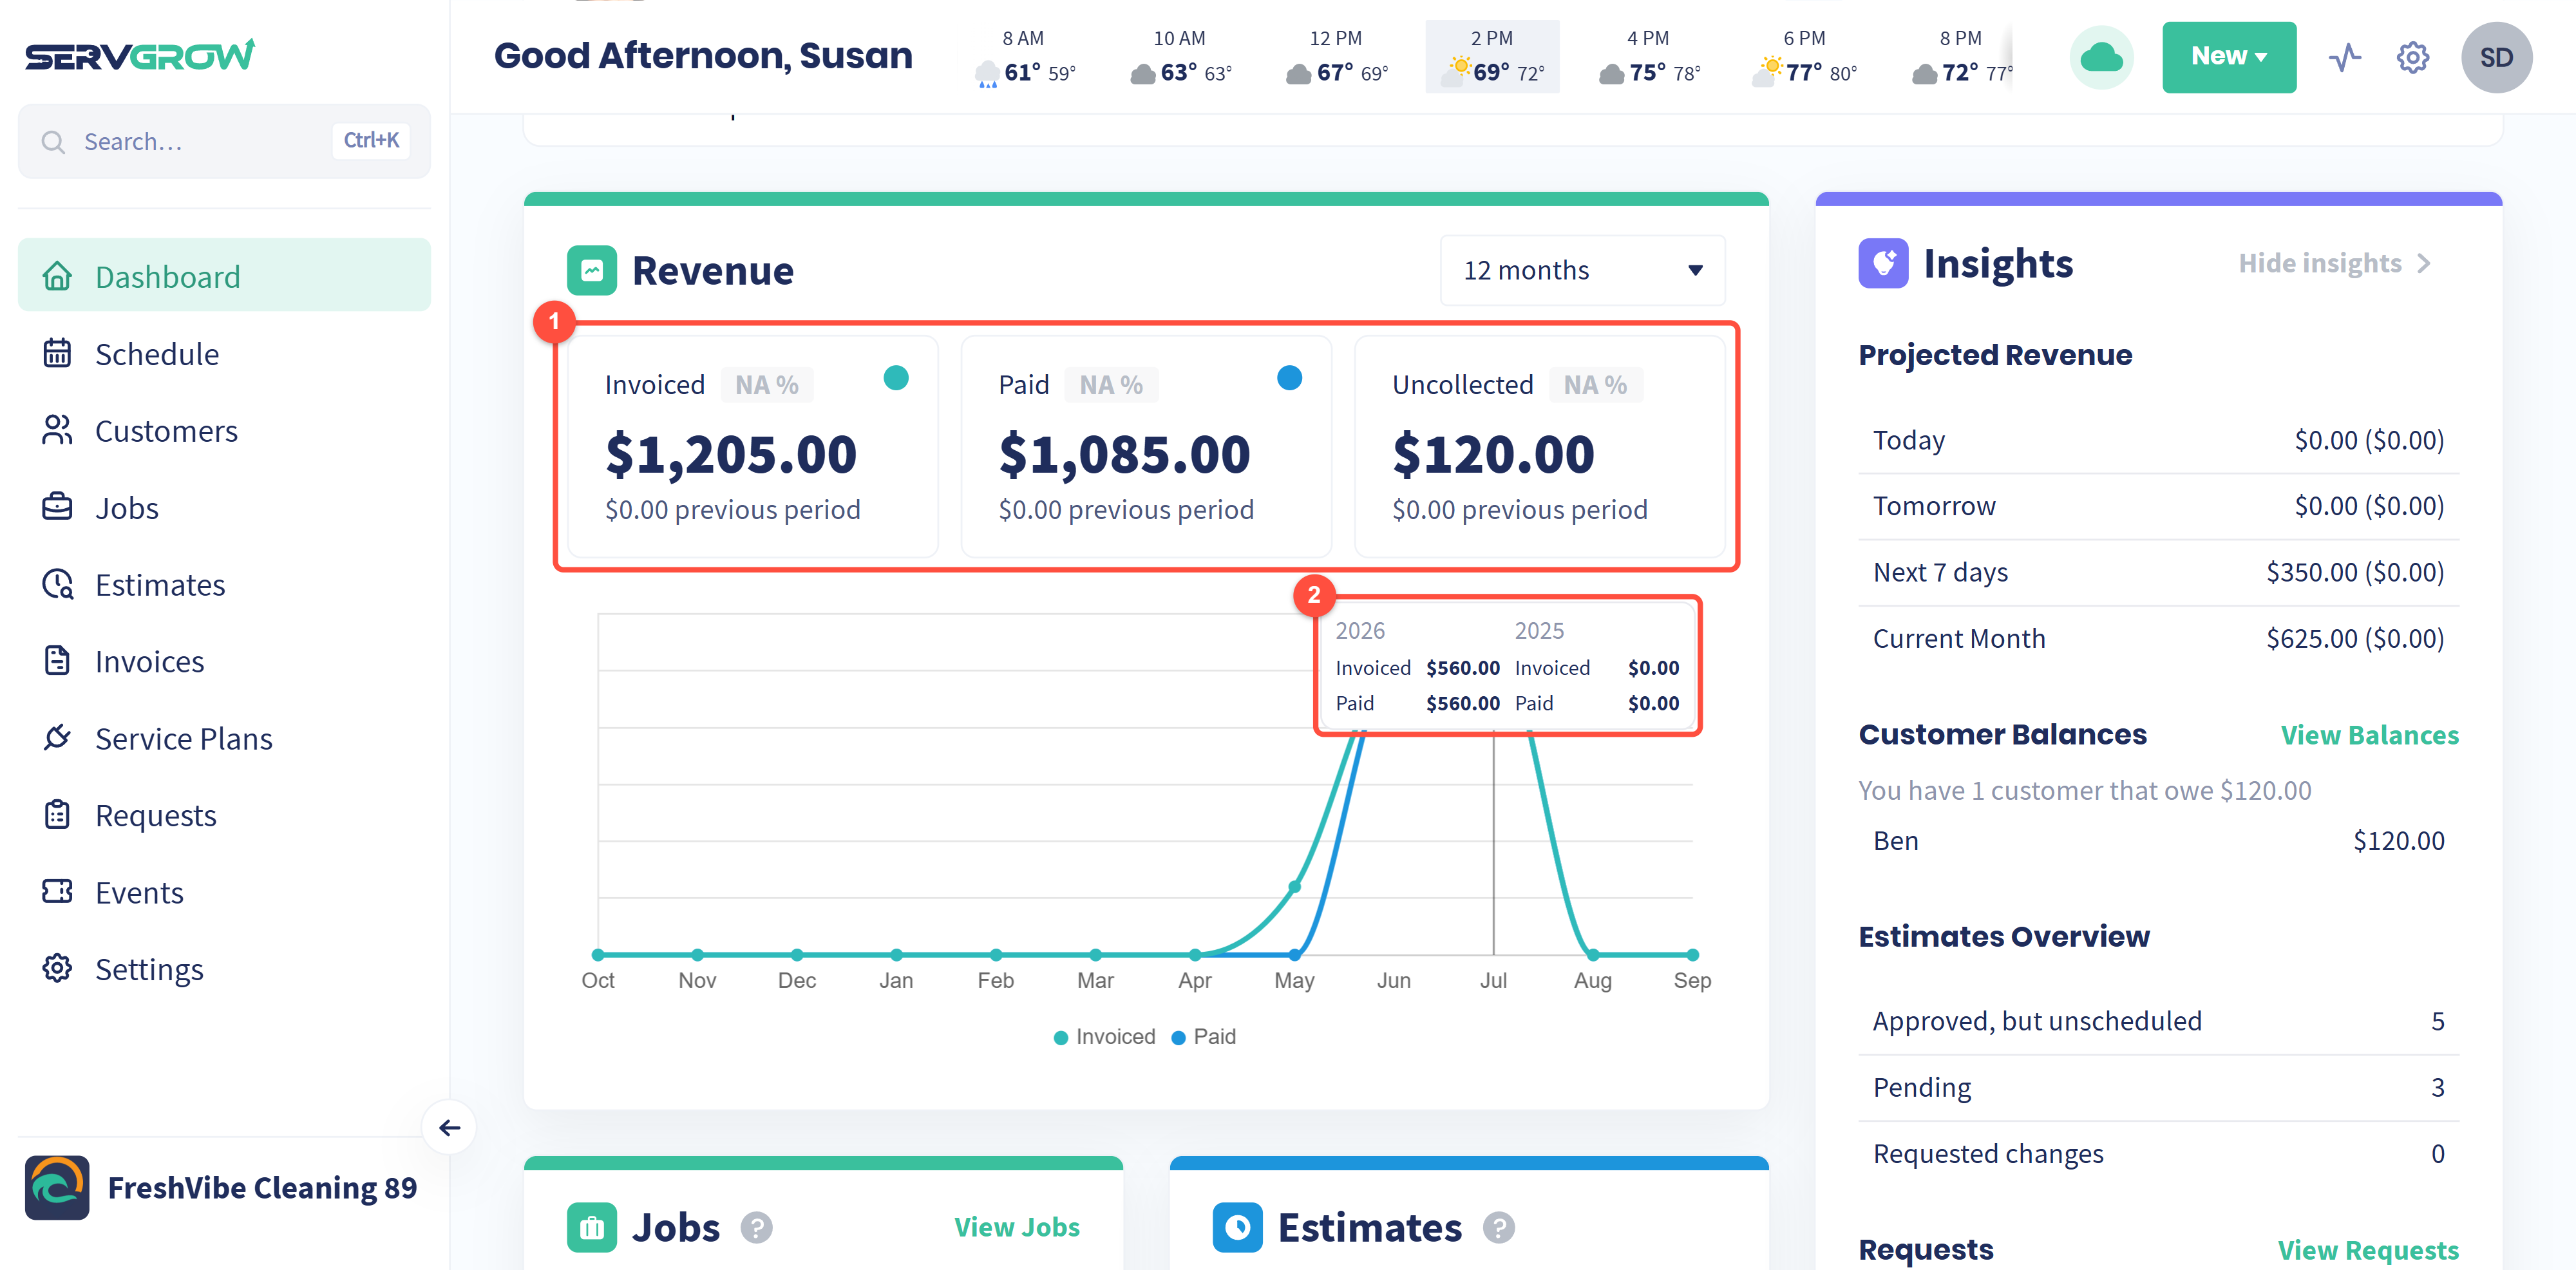
Three totals for the period. Invoiced is what you billed. Paid is what customers have paid. Uncollected is what is still owed. The percentage shows the change from the previous period, and the line underneath shows the previous period's amount.
The chart plots invoiced and paid amounts month by month. Hover over a month to compare it with the same month last year.
A widening gap between Invoiced and Paid means work is getting billed but the money is not coming in. That is your cue to chase payments.
Insights
The Insights panel on the right answers the questions you would otherwise have to dig for.
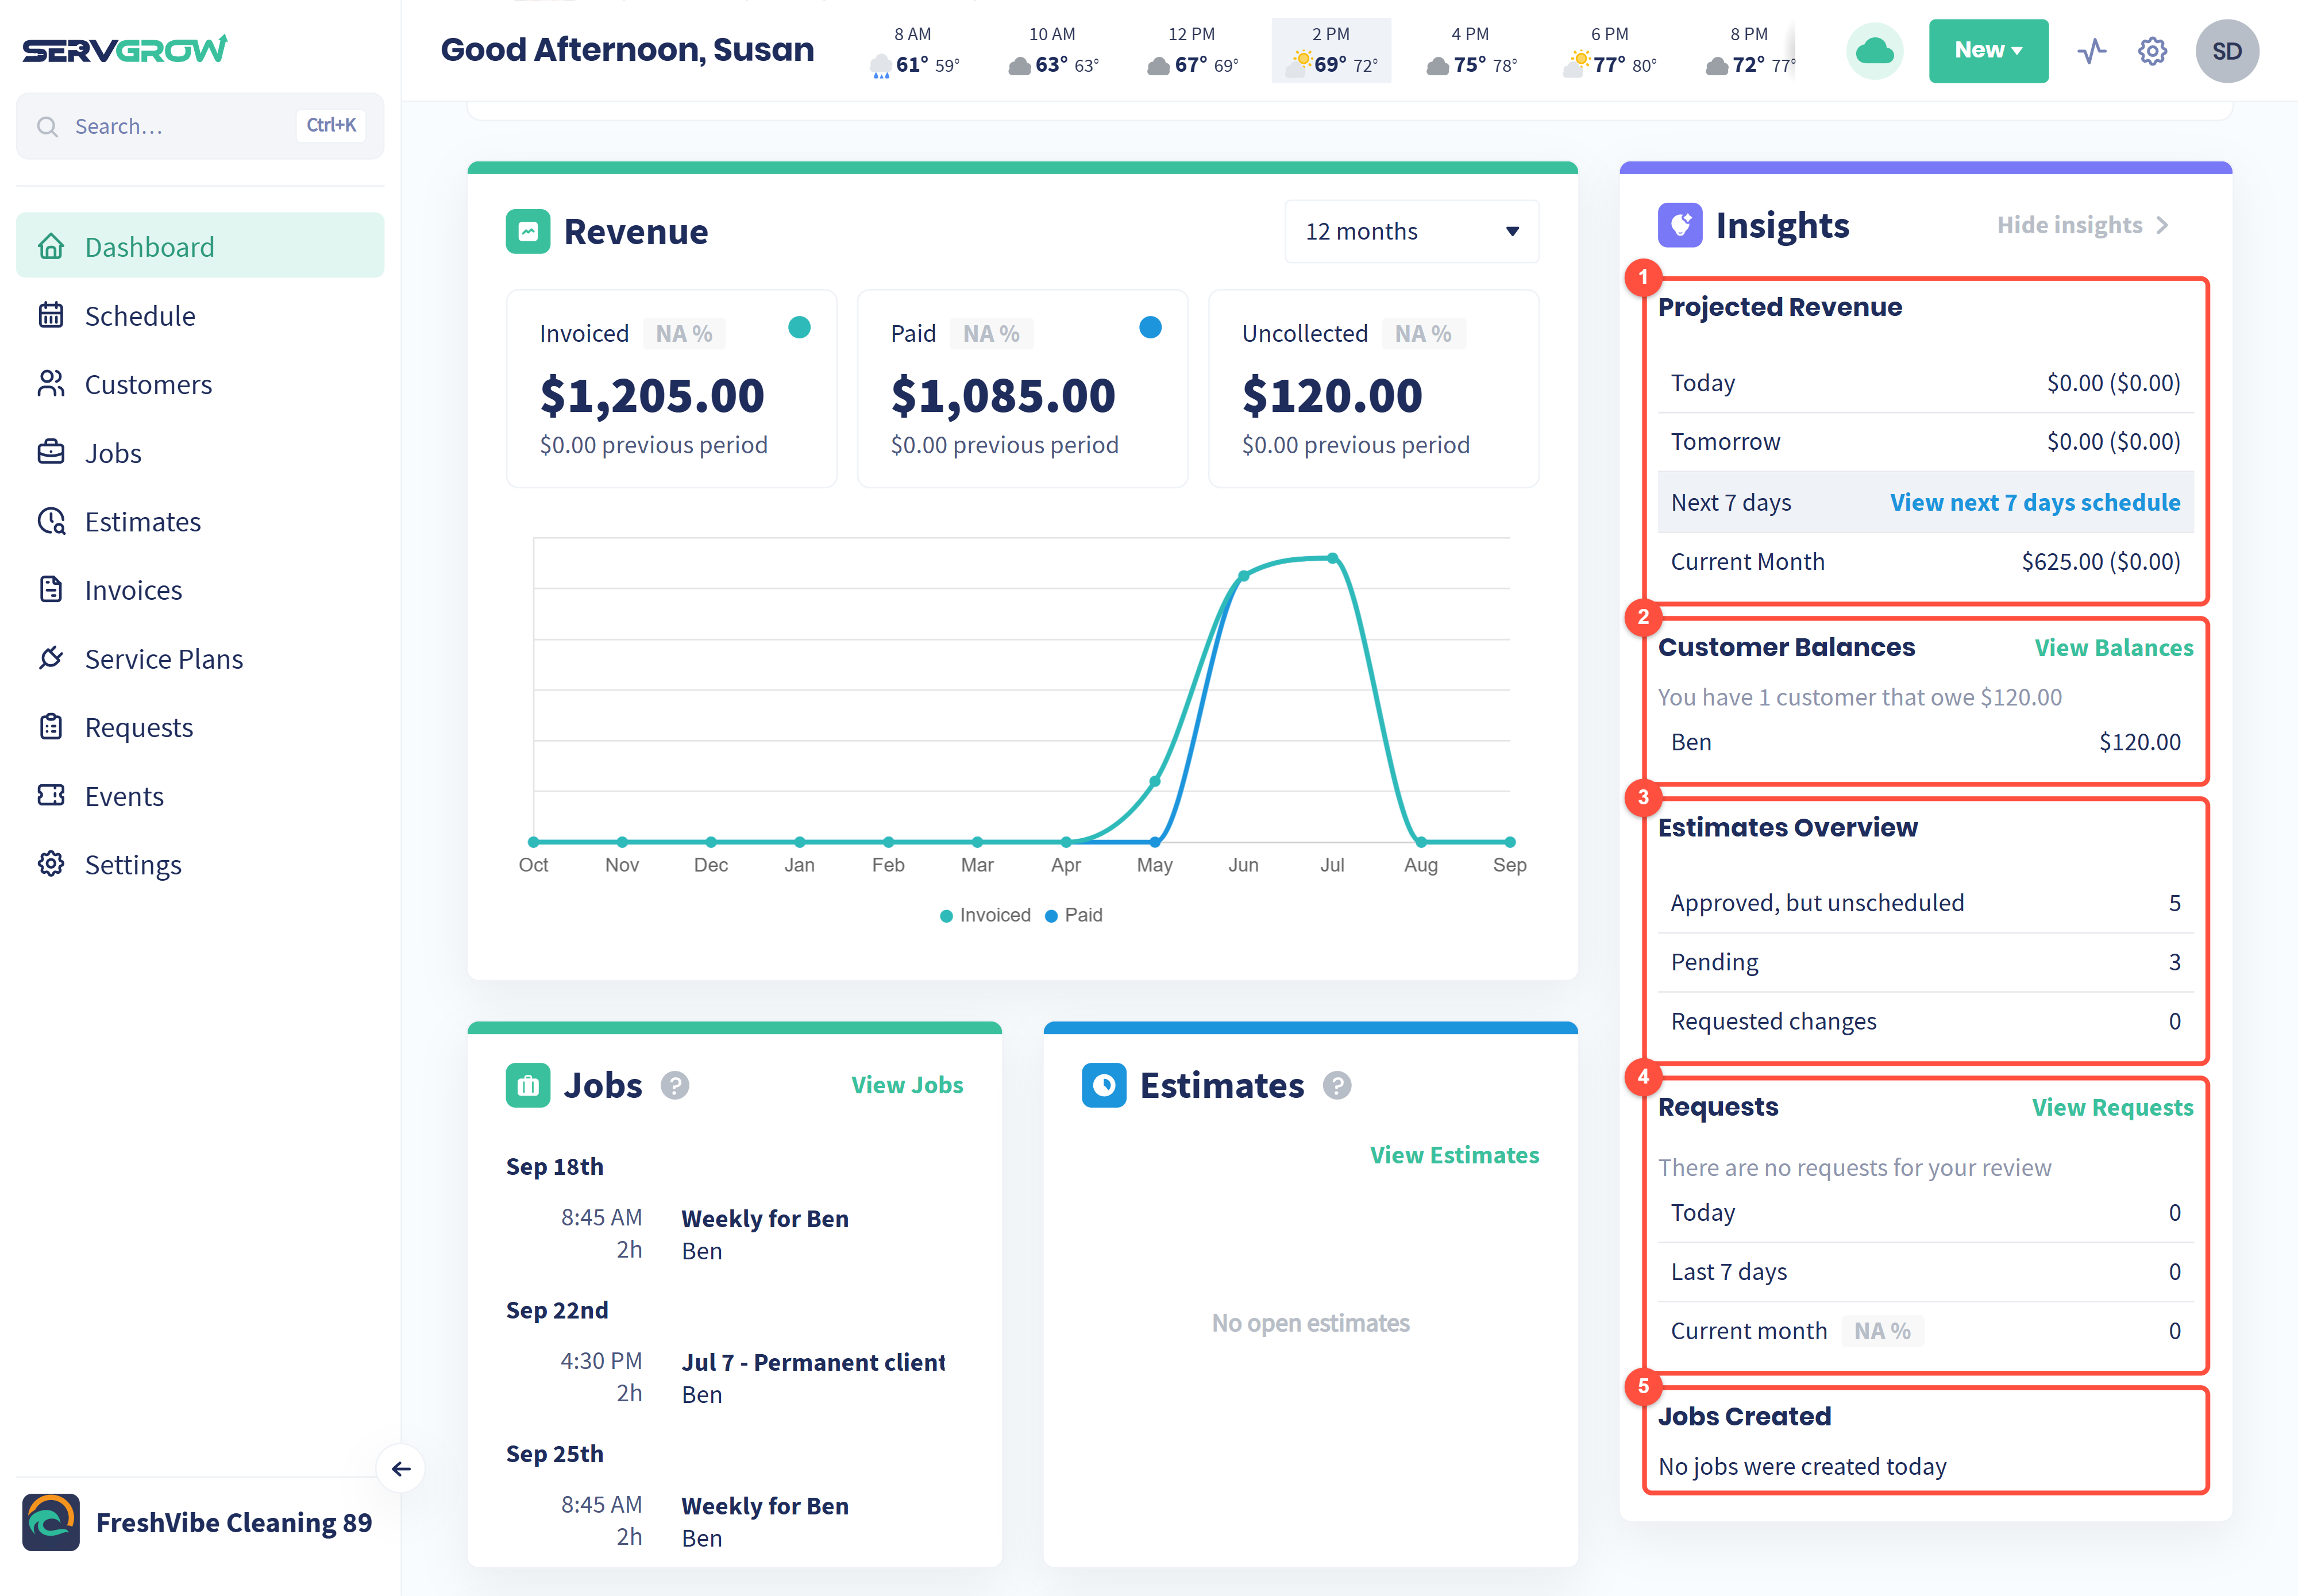
Projected Revenue: what the work on your schedule is worth today, tomorrow, over the next 7 days and for the current month, with the amount already paid in brackets. Hover over a row and click the link to open that stretch of your schedule.
Customer Balances: which customers owe you money and how much. Click View Balances to see their invoices that are due, overdue or have a failed payment.
Estimates Overview: how many estimates are approved but not yet scheduled, still pending, or have changes requested. Click a row to see those estimates.
Requests: how many online booking requests came in today, over the last 7 days and this month, and how many still need scheduling. Click View Requests to work through them.
Jobs Created: how many jobs were created today.
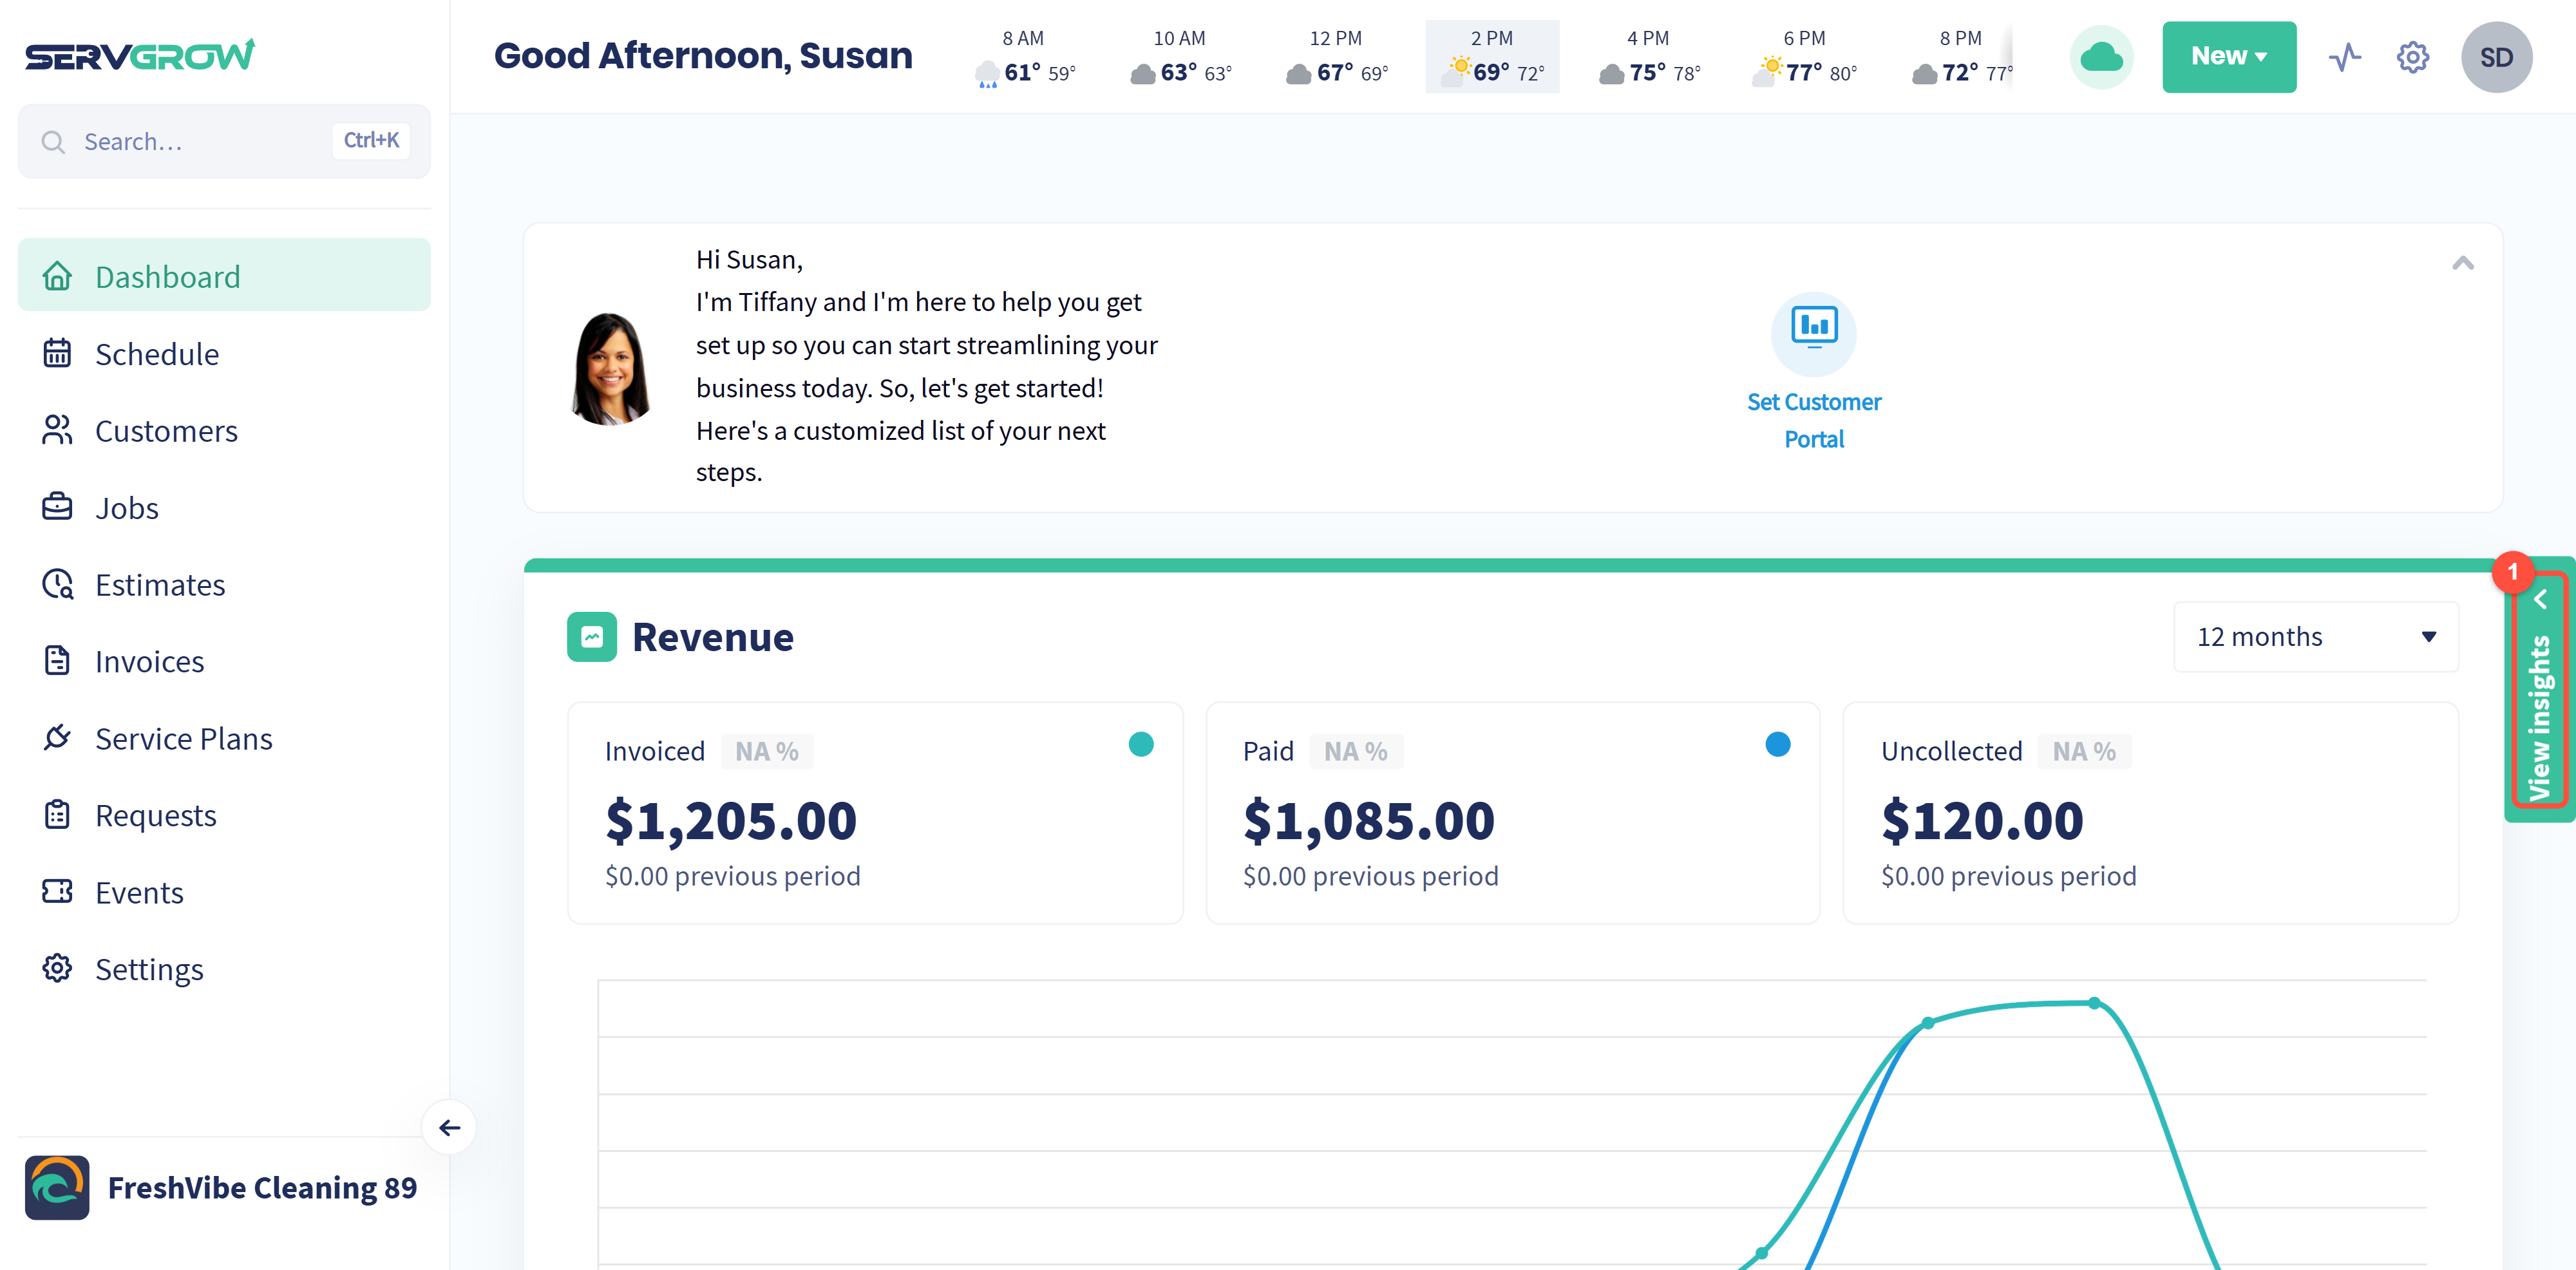
Need more room? Click Hide insights. The panel folds into a View insights tab on the right edge of the screen, and the Revenue panel widens to fill the space. Click the tab to bring Insights back.
Jobs and Estimates
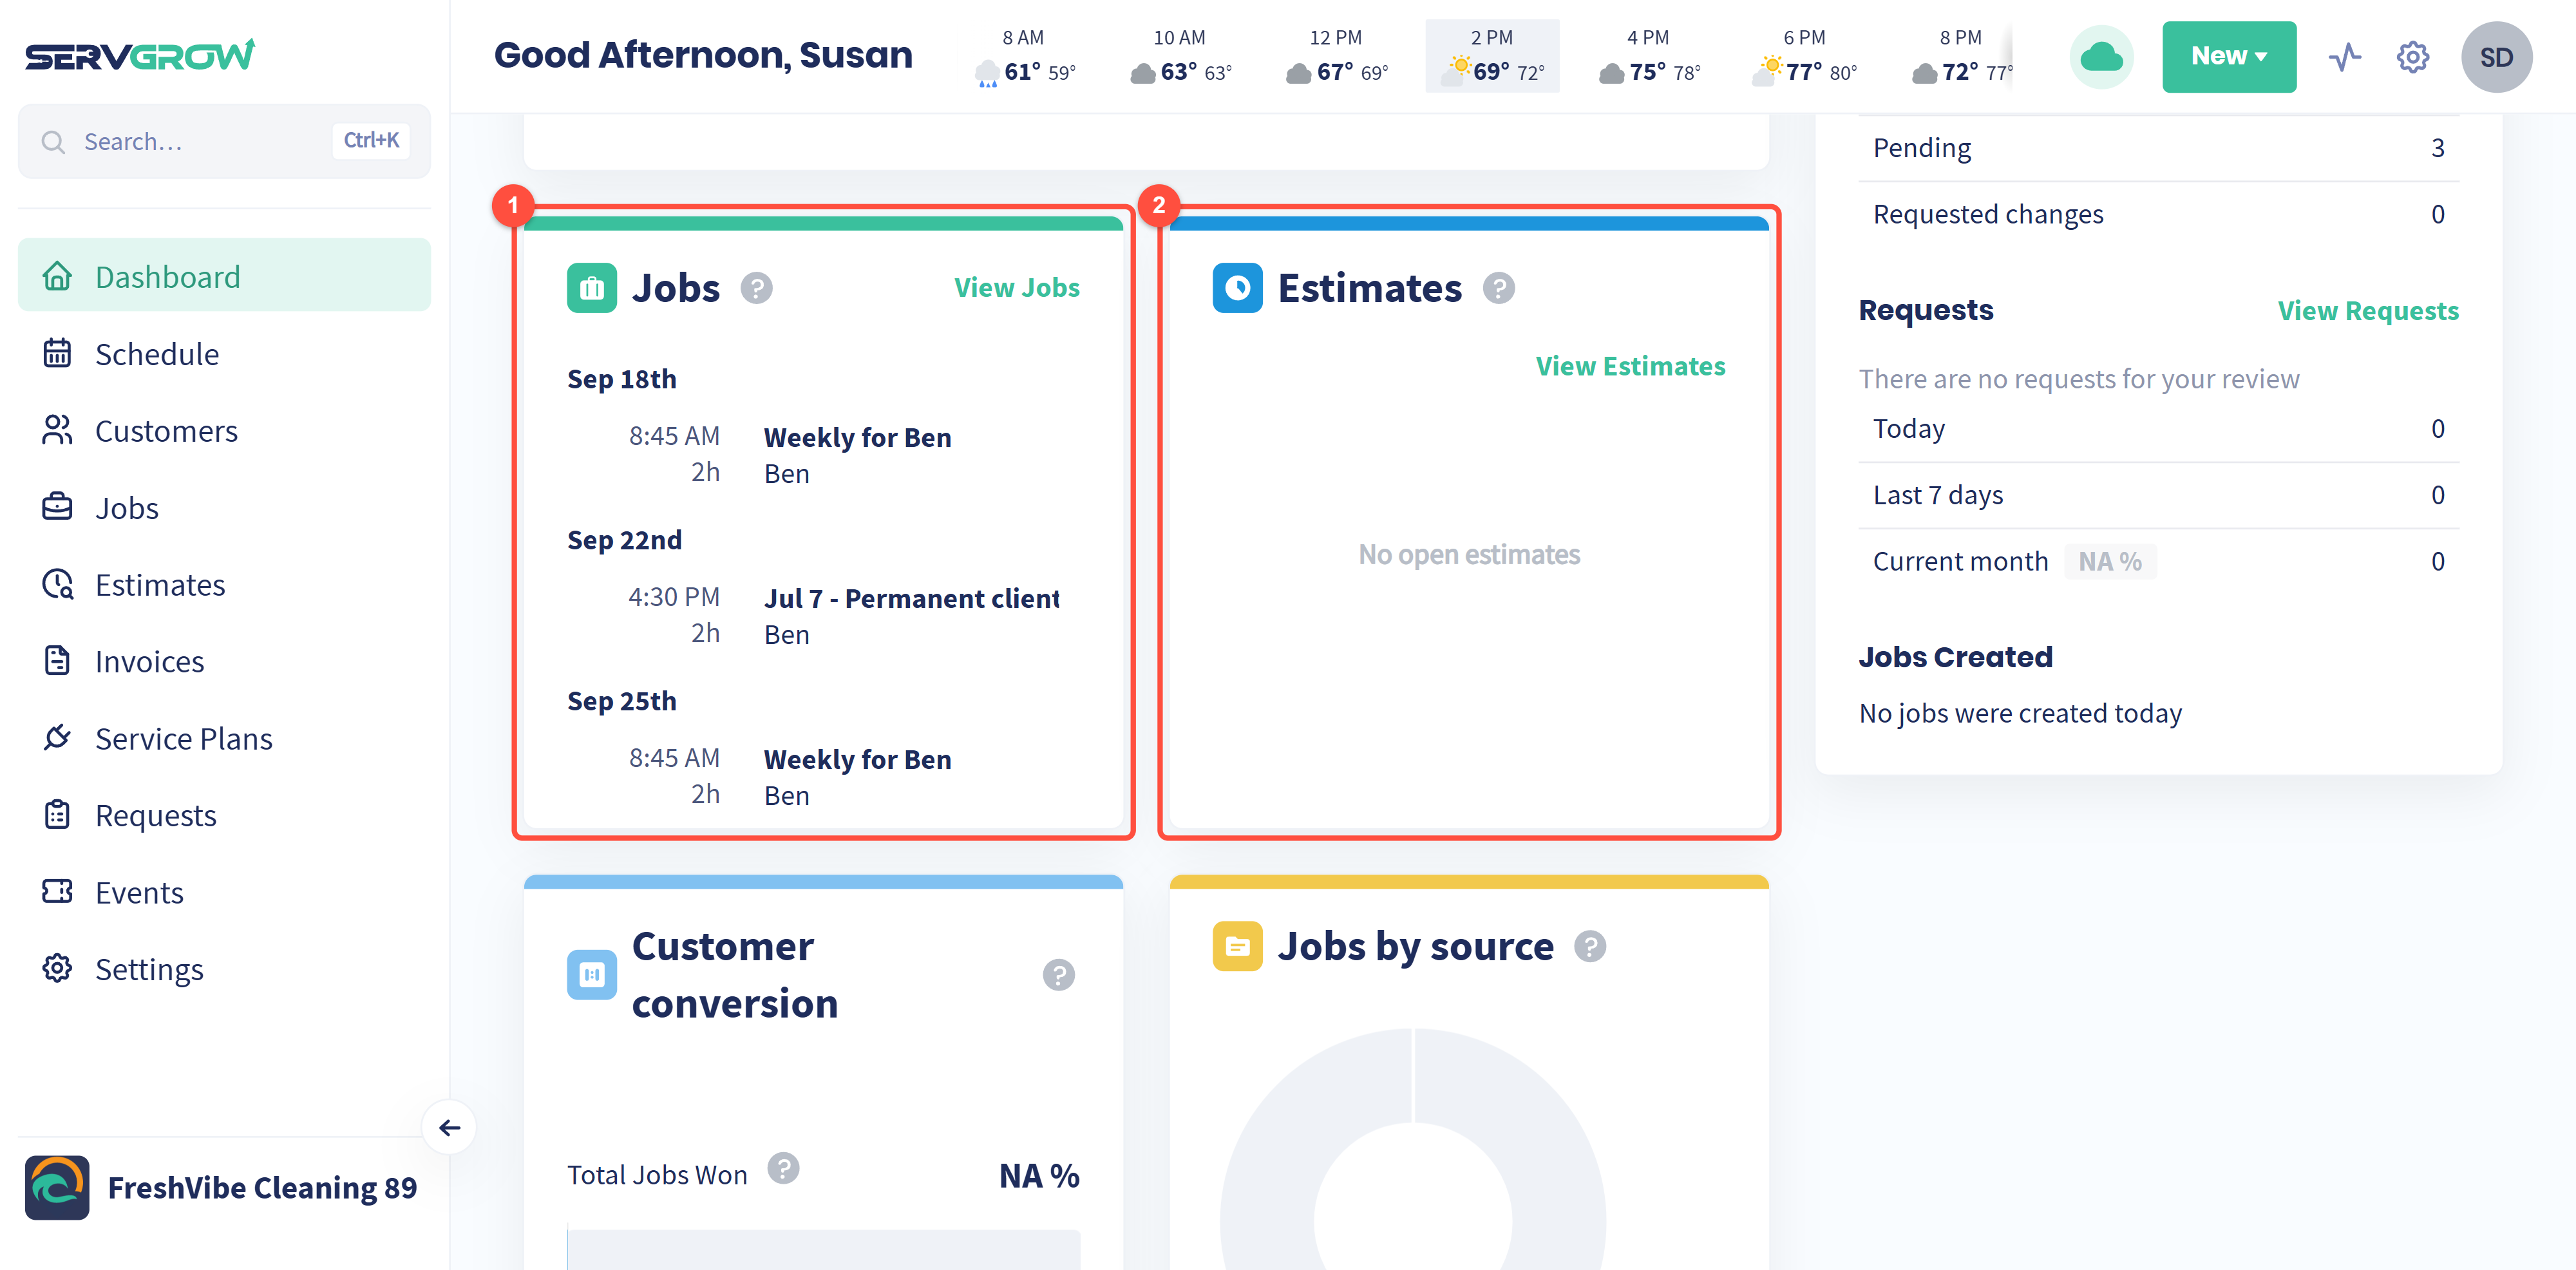
Jobs lists the jobs and service plan visits coming up over the next month, grouped by date, with the start time, length, job name and customer. Click a job to open it, or click View Jobs for the full list.
Estimates lists the estimate appointments scheduled over the next month. Click View Estimates to see all of your estimates.
Customer conversion and Jobs by source
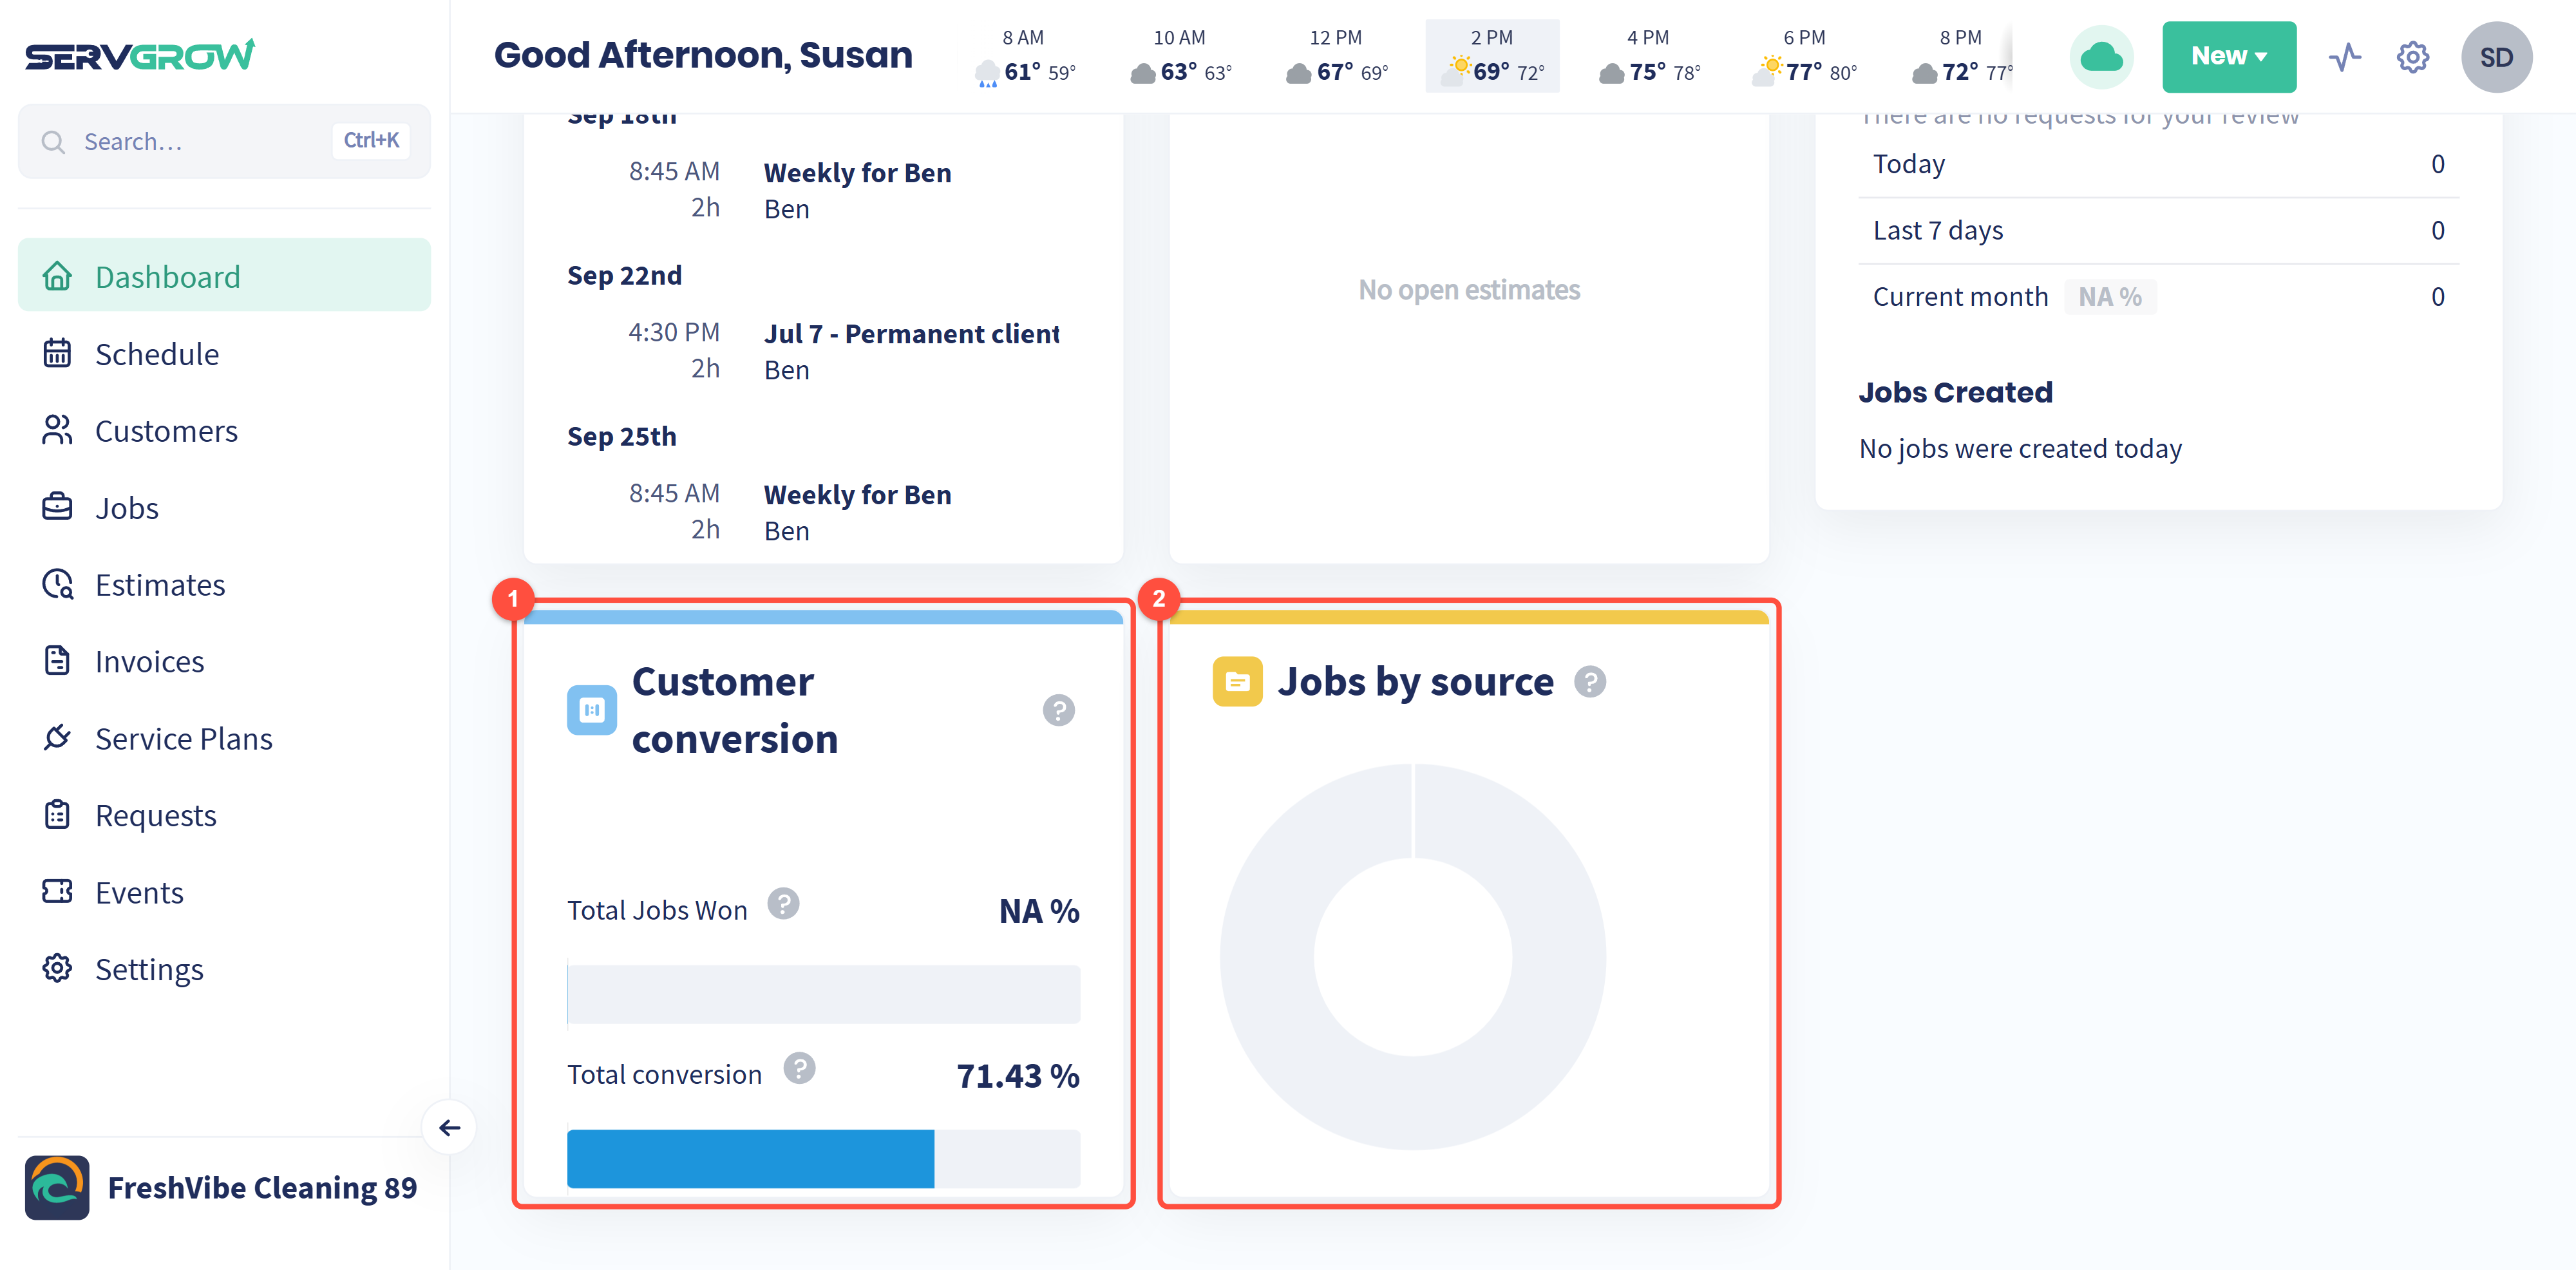
Customer conversion shows two numbers since you started using Servgrow. Total Jobs Won is the percentage of estimates you gave customers that turned into finished jobs. Total conversion is the percentage of the customers you have added who became paying customers.
Jobs by source is a chart of which lead sources bring you the most paying customers. It fills in as you record where your customers came from, using the lead sources set up under Settings, Company Profile, Sources. Use it to decide where your marketing money goes.
Brand new account?
A new account's dashboard starts out showing sample numbers so you can see how everything works. When you are ready to see your own numbers, click Discard Sample Data at the top of the dashboard.
Make it a morning habit
Check Customer Balances first. Every day an invoice sits unpaid, it gets harder to collect.
Schedule "Approved, but unscheduled" estimates next. Those customers already said yes, so do not keep them waiting.
Look at Projected Revenue for the week. A thin week is your signal to follow up on pending estimates or run a promotion.
Review Jobs by source once a month. Put more into the sources that bring paying customers and less into the ones that do not.
Related articles